Biomedical Engineering Reference
In-Depth Information
(a)
(b)
500 µm
500 µm
(c)
(d)
500 µm
500 µm
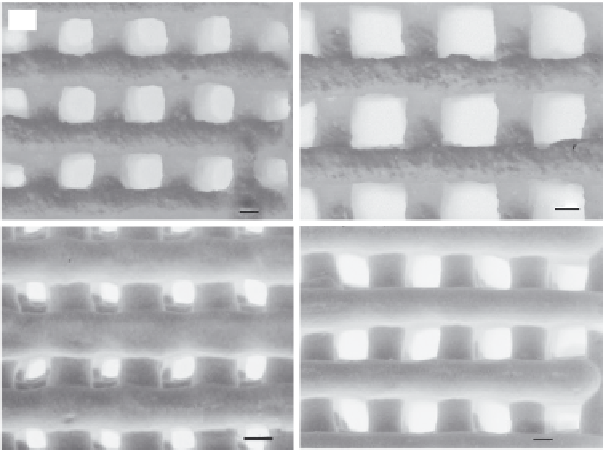
FIGURE 4.16
Light micrographs of plotted (a, b) β-CaSiO
3
and (c, d) mesoporous Ca-Si-P scaffolds with a
different pore size.
mesoporous Ca-Si-P scaffolds. For example, for mesoporous bioglass scaf-
folds prepared by polyurethane templating a compressive strength of only
0.08 MPa was reported (Wu et al. 2011), which is 200 times lower than that
of the plotted mesoporous Ca-Si-P scaffolds described herein. In addition,
compared to other polymer-ceramics composite scaffolds, the PVA-Ca-Si-P
composite scaffolds prepared in this work also have significantly stronger
compressive strength. For example, Kalita et al. (2003) fabricated polypropyl-
ene-TCP composite scaffolds by fused deposition modeling, leading to simi-
lar structures than those achieved by 3D plotting. The compressive strength
of the polypropylene-TCP composite scaffolds with a porosity of 36% was
12.7 MPa (±2 MPa), which is significantly lower than that of our PVA/Ca-Si-P
composite scaffolds, even though these had a much higher porosity of 60%.
We found that the compressive strength and modulus of the plotted meso-
porous Ca-Si-P scaffolds were clearly higher compared to that of the plotted
β-CaSiO
3
scaffolds. The potential reason for this observation relates on the
structure of the mesoporous Ca-Si-P particles with their regular nanochan-
nels and higher specific surface area: the Ca-Si-P particles can be bonded
stronger by PVA due to a partial filling of the nanochannels with the poly-
mer resulting in denser strands after extrusion.
The stress-strain curves of both bioceramic scaffold types indicate that
the stress increased linearly with increasing compressive strain until about
10% deformation (Figure 4.17a,b). After the maximum stress was achieved,
the compressive stress decreased with further increasing strain. However,


Search WWH ::

Custom Search