Biomedical Engineering Reference
In-Depth Information
the strand at the end. The plotting unit is lifted and moved to the start point
of the next strand. If all strands of one layer are deposited, the plotting unit
is moved along the z-axis to start plotting of the next layer. This change of
the position in z-direction is also controlled by the CAD/CAM data set and
depends on different parameters such as the inner diameter of the extrusion
nozzle, material properties, air pressure, and plotting speed, which in turn
affect the strand dimensions. The process is repeated until the whole scaf-
fold is generated. Size and shape of the resulting structure is predefined by
the CAD data set but depend also on the dosing air pressure, plotting speed,
and the diameter of the dosing nozzle.
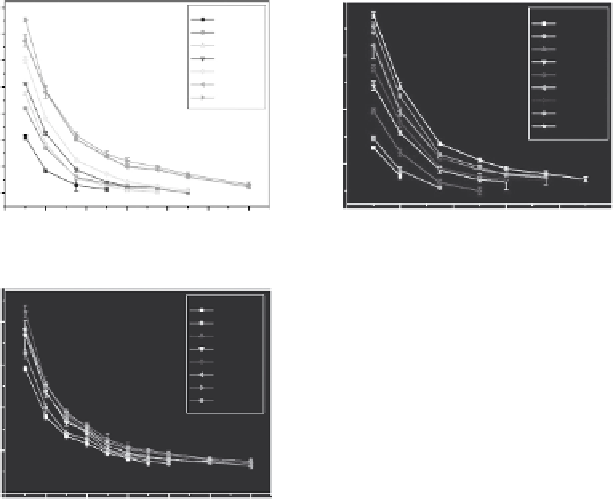
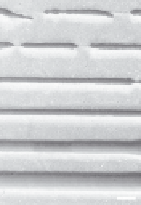
Working air pressure and plotting speed have to be carefully adapted to
each other and optimized for the used nozzle diameter to ensure the extru-
sion and deposition of homogeneous strands. Figure 4.4 demonstrates their
influence on strand width: an increase of the plotting speed and a decrease
of the air pressure result in a decreased width of plotted strands, an obser-
vation that has been made for different needle diameters. If the speed is too
1600
3200
ID = 0.61 mm
3.0 Bar
3.6 Bar
4.2 Bar
4.8 Bar
5.4 Bar
6.0 Bar
6.6 Bar
ID = 0.4 mm
3.0 Bar
3.6 Bar
4.2 Bar
4.8 Bar
5.4 Bar
6.0 Bar
6.6 Bar
7.2 Bar
8.0 Bar
2800
2400
2000
1600
1200
800
400
1200
800
400
0
4 8
Plotting Speed (mm/s)
12
16
20
048
Plotting Speed (mm/s)
12
16
20
24
(a)
(b)
17 mm/s
15 mm/s
ID = 0.2 mm
6.0 Bar
6.5 Bar
7.0 Bar
7.3 Bar
7.7 Bar
8.0 Bar
8.3 Bar
8.6 Bar
15 mm/s
800
12 mm/s
12 mm/s
600
10 mm/s
10 mm/s
7 mm/s
400
7 mm/s
4 mm/s
4 mm/s
200
2 mm/s
2 mm/s
0
024
Plotting Speed (mm/s)
68
10
12
ID = 0.4 mm
P = 5.4 Bar
ID = 0.61 mm
P = 4.8 Bar
(c)
(d)
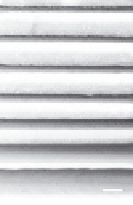
FIGURE 4.4
The relationship between plotting speed and diameter of plotted strands as a function of air
pressure. Different nozzles were used with inner diameters (ID) of (a) 0.61 mm, (b) 0.4 mm,
and (c) 0.2 mm. (d) Photographs of CPC strands plotted under different air pressures and
plotting speeds.
Search WWH ::

Custom Search