Information Technology Reference
In-Depth Information
the probability of 60 % of a segment to be an overlap and 40 % to be a nonoverlap.
There are various strategies for computing these probabilities, such as Platt's
method (Platt
2000
), isotonic regression (Zadrozny and Elkan
2002
), and Bayesian
methods (Sollich
2002
). These probabilities are useful to integrate expert classifiers
such as overlap classifiers in a global decision process. This approach is a flexible
architecture for making decisions without global optimization. The method of
computation of the posterior probabilities depends on the chosen set of clips.
The goal is to obtain a consistent computation of the posterior probabilities from
the different corpora (Train, Development, and Test sets). For the Train and
Development sets, the posterior probabilities have been computed by performing
cross-predictions on the union of these two sets. This process consists of splitting
the data set into
s
disjoint folds and predicting class posterior probabilities of each
instance of a fold from a model trained on the
s
1 other folds. Sixteen folds have
been chosen that have participant independence between two folds. For the Test
set, the posterior probabilities have been computed from a model trained on the
union of the Train and Development sets. A total of 120 posterior probabilities were
computed for each clip: 60 for the
f
N, O
g
_1 detector, 30 for
f
N, O
g
_2, 12 for
f
N,
O
g
_5, and 18 for
f
N, L, H
g
_5.
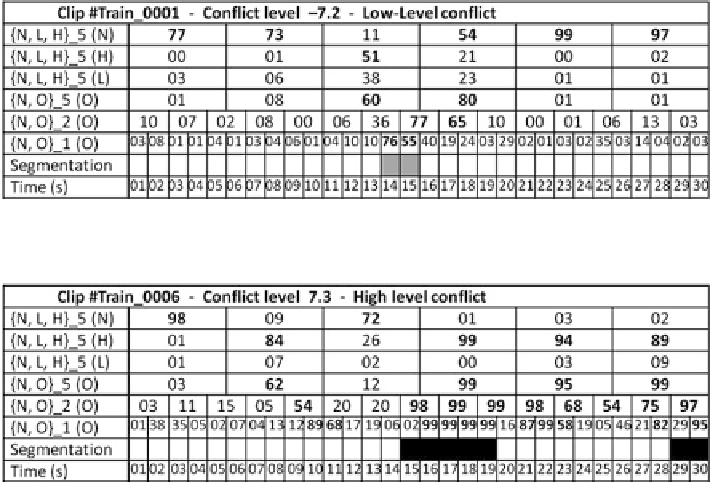
Figures
18.8
and
18.9
give an instance of the posterior probabilities from the four
overlap detectors (
f
N, O
g
_1,
f
N, O
g
_2,
f
N, O
g
_5, and
f
N, L, H
g
_5), respectively, for
the LLC clip #Train_0001 and the HLC clip #Train_0006. The row called
Time
gives
Fig. 18.8
Overlap posterior probabilities as percentages for the Train_0001 clip with low-level
conflict
Fig. 18.9
Overlap posterior probabilities as percentages for the Train_0006 clip with high-level
conflict
Search WWH ::

Custom Search