Information Technology Reference
In-Depth Information
Fig. 18.2
Average of the number of interruptions as a function of the CSR
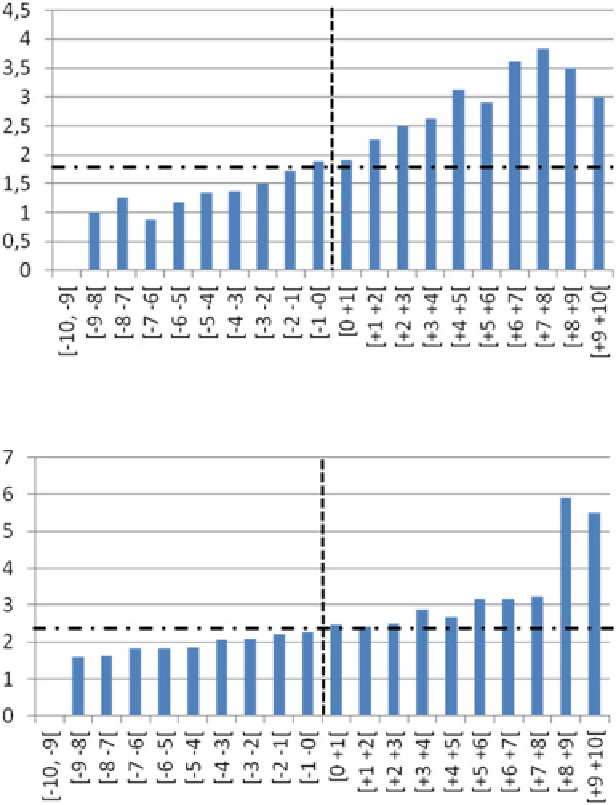
Fig. 18.3
Overlap mean duration (in s) as a function of the CSR
Figure
18.3
shows the histogram of the overlap mean duration for each CSR. The
horizontal dashed line represents the average of the overlap duration in the Train set
(2.45 s
D
3,600.6/1,471). HLC clips have a mean duration of overlap that is higher
than the LLC clips.
Figure
18.4
shows the histogram for each CSR of the percentage of overlap
duration. The horizontal dashed line represents the mean percentage of the overlap
duration of the Train set clips (15.1 %
D
3,600.6/23,774). The conflict level is shown
to be highly correlated to the percentage of overlap duration as in related work (Kim
et al.
2012b
).
Search WWH ::

Custom Search