Information Technology Reference
In-Depth Information
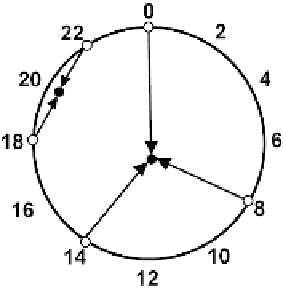
Fig. 4.2.
Example of the representation of a set of time-stamps in ChronoView.
In Fig. 4.1, 00:00 (midnight) is set to
t
0
and a period
c
is 24 h. When
c
is 1 h, ChronoView represents a diagram of a one-hour period. When
c
is
168 h (i.e., seven days), it represents a diagram of a one-week period. In a
similar way, ChronoView can represent a one-month or one-year period.
However, we need a slight modification to create such diagrams, because
the length of months and years is not constant. For example, let us
consider the case where
c =
24 h. Fig. 4.2 shows two cases. If an event
occurs at 00:00, 08:00, and 14:00, the event is placed near the centre of the
circle. If another event occurs at 18:00 and 22:00, the event is placed at a
position close to 20:00 on the chord between 18:00 and 22:00. By
representing the event using this position, it is easy to observe whether the
event has occurred in a wide range of time periods, or has occurred only
during certain times.
Representation of Attributes of Events
Events have attributes such as text labels and categories. The number of
occurrences, i.e., the number of time-stamps, can also be regarded as an
attribute. If we can visualize these attributes while representing the events,
it becomes easy to analyse the features of the events.
Some retinal variables [20], such as colours, shapes, and sizes, can be
used independently of position. Therefore, we use retinal variables to
represent such attributes. In Fig. 4.1, every event is represented as a light
blue circle with a white label, and the size of the circle indicates the
number of occurrences. Thus, events that occur often are expressed as
large, conspicuous circles. The circle colour indicates the category of the
events. In Fig. 4.1, events are not categorized and have been shown in the
Search WWH ::

Custom Search