Information Technology Reference
In-Depth Information
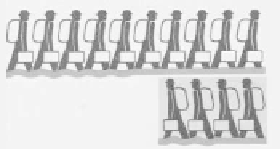
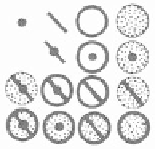
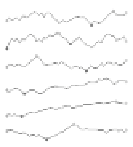
Fig. 3.5.
Left: Immigration from/to Italy 1920-1927 [Neu30]: Direction of the
figure indicates departures (facing right) and arrivals (facing left), while the base
indicates mode of transport with wavy blue indicating water transport and
horizontal brown indicating land transport. Middle: Four different shapes (dot,
line, outline circle, shaded circle) combine to represent 16 possible combinations
[Ber67]. Right: Sample sparklines [Tuf96].
The above examples represent the common ways in which shape is used
today in information visualization. But none of the above approaches use a
framework based on attributes of shape. While a few attributes of shape
have been suggested by some visualization researchers, there had been no
systematic review of the many possible dimensions of shape. With a better
understanding of shape, there is potential for new types of visualization as
well as more expressive and flexible representations.
Part of the difficulty in addressing the use of shape attributes within
visualization is that the definition of shape can be ambiguous: a visual
interpretation of a geometric primitive may be based on visually scanning
the perimeter of the shape, whereas the visual interpretation of an icon
may require a visual analysis of both the perimeter and interior of the
form. To have a focused analysis, the emphasis here will be largely on the
perimeter of the shape.
Background
Attributes of shape have long been used in other fields. For example, in
A
Field Guide to the Birds
by Roger Peterson [Pet02], 10 out of 16 bird
identification criteria are shape related attributes (e.g. wing shape, bill
shape, marks, bars, pattern shapes). In graphic design, attributes such as
line endings, corner types and line styles are regularly discussed. There are
many different potential domains of reference to consider - a few different
domains are given below, such as visualization research, biology and
graphic design.
Search WWH ::

Custom Search