Information Technology Reference
In-Depth Information
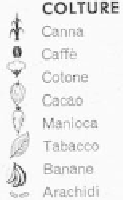
Fig. 3.3.
Left: Intuitive pictographic icons representing crops grown in Tanzania
[Ins50]. Right: Transport by walking or motor car in various countries indicated by
rows of pictographs [Bri39].
x
Symbols
: These are learned signifiers such as letters, numbers and
other graphical symbol systems (e.g. music notation, dance
notation, weather symbols), which in turn may act as labels on a
plot (Fig. 3.4). The limitation with symbols is that they convey only
a single data attribute which then requires a visual lookup in
another visual component to decode.
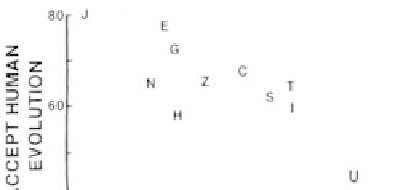
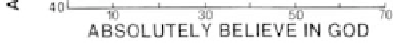
Fig. 3.4.
Scatterplot using letters to uniquely identify each point. Based on
[Pau05].
x
Compound glyphs
: A compound glyph uses only one or two of the
above shape elements in the creation of a glyph [Rop11], such as an
icon on top of a circle or square; or a collection of superimposed
primary shapes; or tiny glyphs such as sparklines which use a single
attribute (e.g. a line in a line chart) (Fig. 3.5).


Search WWH ::

Custom Search