Information Technology Reference
In-Depth Information
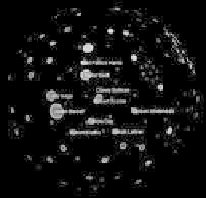
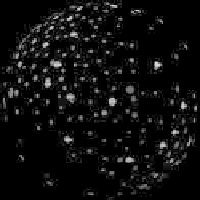
SphereCorr was tested with different data, including:
•
Twitter users
: 140 twitter users correlated on weekly search
volumes over five years. A number of different distinct clusters
emerge in this data (Fig. 2.10, left).
•
Emails
: 375 people linked based on cc's (not based on time series
correlations). This dataset was not fully connected (Fig. 2.10,
middle).
•
Stocks
: 200 high-capitalization stocks correlated on daily price
changes over 2010 (Fig. 2.10, right).
Fig. 2.10.
Left: Correlation of 140 popular Twitter feeds coloured by author
category. Centre: 375 people sending email to author, proximity based on
commonality of cc's. Right: 200 high-cap stocks, coloured by the correlation to the
selected stock near front centre.
SphereTree
SphereCorr only used the outer surface of the sphere and did not attempt
to use any interior volume. Walrus [Hug04] and earlier H3 [Mun97], [98]
previously represented hierarchies within a spherical volume, but did not
utilize size of visual items to convey data attributes. An attempt was made
to “mash” visual techniques together: SphereTree attempted to combine a
treemap (e.g. [Joh91], [Bru99]) projected onto a sphere together with an
internal hierarchy through the centre of the sphere.
The hierarchy was a successive series of concentric shells, each
treemap not filling its area, leaving gaps to view successive underlying
shells. Difficulties visually associating patches of the treemap with the
corresponding parent/children within the hierarchy led to iterative
exploration and adjustments, eventually settling on replacing inner shells
with a ball-and-stick hierarchy inside the sphere.
Interaction was implemented similarly to
SphereCorr
. Narrative tied to
viewpoints was used to assemble narrative sequences that positioned
interesting data near the horizon (only partially visible) that would be

Search WWH ::

Custom Search