Information Technology Reference
In-Depth Information
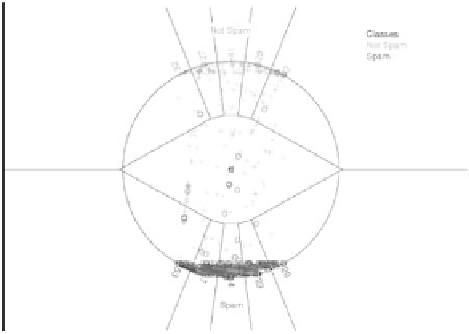
Fig. 13.16.
Voronoi diagram of the Spam data set. Q score is 0.380
[9].
References
[1] K. Daniels, G. Grinstein, A. Russell, & M. Glidden, “Properties of normalized
radial visualizations,”
Information Visualization
, vol. 11, no. 4, pp. 273-300,
2012.
[2] P. Hoffman, G. Grinstein, K. Marx, I. Grosse, and E. Stanley, “DNA visual and
analytic data mining,” in
Visualization '97., Proceedings
, October 1997, pp.
437-441.
[3] M.L. Ujwal, P. Hoffman, K.A. Marx, “A Machine Learning Approach to
Pharmacological Profiling of the Quinone Scaffold in the NCI Database: A
Compound Class Enriched in Those Effective Against Melanoma and
Leukemia Cell Lines”,
Bioinformatics and Bioengineering, 2007. BIBE 2007.
Proceedings of the 7
th
IEEE International Conference on
, 14-17 October 2007,
pp. 456-463.
[4] M. Ankerst, S. Berchtold, and D. A. Keim, “Similarity Clustering of
Dimensions for an Enhanced Visualization of Multidimensional Data,” in
Proceedings of the IEEE Symposium on Information Visualization
, G. Wills
and J. Dill, Eds. IEEE Computer Society Press, 1998, pp. 52-60.
[5] J. Zhou, G. Grinstein, and M. Kenneth, “A heuristic for gene selection and
visual prediction of sample type,”
International Journal of Data Mining and
Bioinformatics
, vol. 5, no. 4, pp. 428-448, 2011.
[6] J. Khan, J. S. Wei, M. Ringner, L. H. Saal, M. Ladanyi, F. Westermann, F.
Berthold, M. Schwab, C. R. Antonescu, C. Peterson, and P. S. Meltzer,
“Classification and diagnostic prediction of cancers using gene expression
profiling and artificial neural networks,”
Nature Medicine
, vol. 7, no. 6, pp.
673-679, Jun. 2001.
[7] W. Peng, M. Ward, and E. Rundensteiner, “Clutter Reduction in Multi-
Dimensional Data Visualization Using Dimension Reordering,” in
IEEE


Search WWH ::

Custom Search