Information Technology Reference
In-Depth Information
for a convex polygon is O(log
n
)
[11] so we have a total of O(
n
log
n
).
Finally, the actual calculation of
Q
is done in constant time.
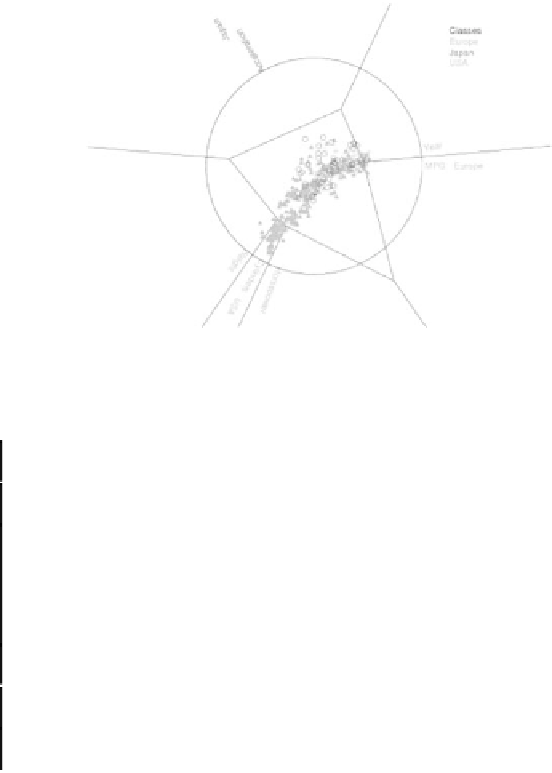
Fig. 13.14.
Voronoi diagram of the Cars data set with dimensions selected with
mean ratio and arranged in a class discrimination layout (CDL) with AAM
placement. Q score is -0.577
[9].
Dimensions
Selected
Data set
Dimensions
Classes
Q score
Remarks
maximum 5
per class
Cars [15]
7
3
-0.577
No classes.
All
dimensions
used.
Htong [15]
4
4
N/A
0.145
DAs
placed
uniformly.
Khan
SRBCT [6]
maximum 5
per class
2308
4
0.619
maximum 7
per class
Spam [16]
57
2
0.380
Transfusion
[17]
maximum 3
per class
5
2
0.789
Table 1.
The
Q
scores of several publicly available data sets
[9]. All except
Htong, as noted, used CDL+AAM positioning.


Search WWH ::

Custom Search