Information Technology Reference
In-Depth Information
x
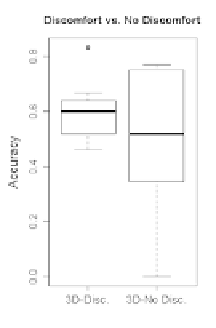
No
_
Discomfort
(
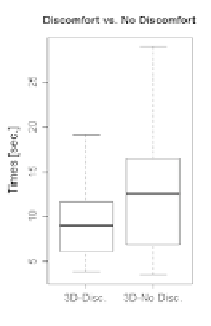
=0.510) differ by 18%. The median of times differs by 38%
~
~
x
Discomfort
No
_
Discomfort
(
=9.02 and
=12.54), respectively.
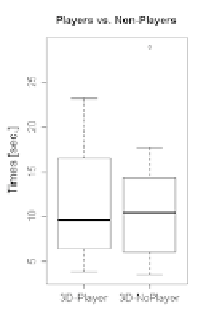
Frequent game playing
A final finding concerns
frequent game playing
, which was reported by
n
1
=6 subjects, or 33%. The boxplots in Fig. 12.11 show the unexpected:
there were no differences in accuracy (c) or times (d) between the groups
in the 3D visualization condition.
(b)
(a)
(c)
(d)

Search WWH ::

Custom Search