Information Technology Reference
In-Depth Information
(a)
(b)
(c)
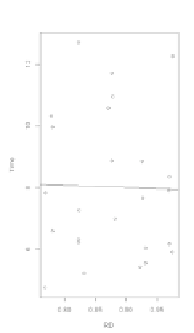
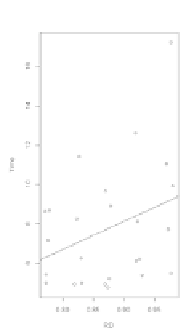
Fig. 12.7.
Plots of average response times and degree of difficulty RD for stimuli
at different conditions. Tilt angles are: (a) 45
ͼǢ
(b) 55
ͼǢ
(c) 65
ͼ
.
Degree of difficulty
As previously described, the assessment of distances between a number of
positions on the map (or of the lengths of imaginary line segments
between them) is supposedly affected by the degree of difficulty (RD) in
each stimulus image. To study potential associations of response times and
accuracy with the degree of difficulty, an evaluation of time and accuracy
was done per stimulus. Accuracy is now determined as the number of
correct responses per 18 observations (subjects) for each of the 25 stimuli.
Likewise, average time per stimulus is calculated from the 18 individual
time observations per stimulus. Subsequently, a correlation analysis was
carried out to investigate relationships between the degrees of difficulty of
stimuli and observed average times and accuracies in each of the three
visualization conditions. Since average accuracy is determined from only
18 discrete observations, it is here considered a quasi-discrete, rather than
a continuous quantity. The subsequent analysis comprises, therefore, a
series of Spearman correlation tests with RD and accuracy or time as
variables. Visual inspection of the scatterplots in Fig. 12.6 suggests that
accuracy is negatively associated with increasing degree of difficulty. This
is reflected by negative Spearman coefficients r
s
=-0.33 (45
ͼ
condition),
r
s
=-0.43 (55
ͼ
condition), and r
s
=-0.61 (65
ͼ
condition). However, the
strengths of this association vary. Correlation tests with the alternative
hypothesis H
1
: r
s
<0.0 and a significance level 0.05 allow rejection of the

Search WWH ::

Custom Search