Information Technology Reference
In-Depth Information
(a)
(b)
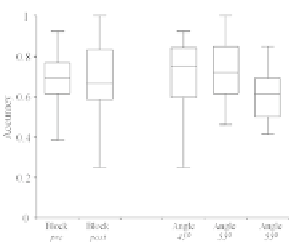
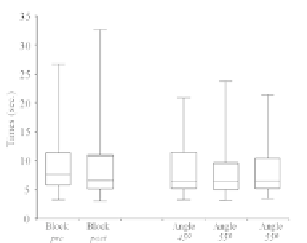
Fig. 12.5.
Comparison of performance for blocks and visualization conditions.
Observed accuracy (a) (1.0 means 100% correct answers) and response times in
seconds (b).
(a)
(b)
(c)
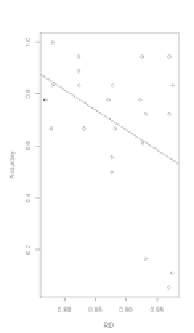
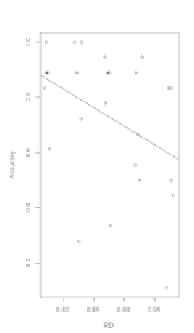
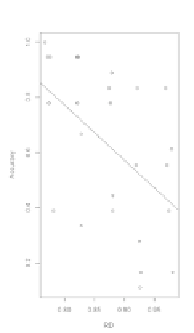
Fig. 12.6.
Plots of accuracy and degree of difficulty RD for stimuli at different
conditions. Tilt angles are: (a) 45
ͼǢ
(b) 55
ͼǢ
(c) 65
ͼ
.
Search WWH ::

Custom Search