Information Technology Reference
In-Depth Information
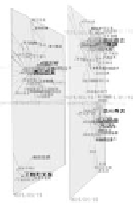
us to observe a visual overview by normal 3D view to find areas of interest
and then change the view mode to a parallel view to explore the areas in
detail. This is basically done by automatically sliding TimeSlices in the
direction of depth (Figure 8.5 (b)), changing the eye position to see
TimeSlices from the front, then changing the projection mode. After that, a
parallel view can be obtained as shown in Figure 8.5 (c). The same nodes
in different TimeSlices are displayed in different positions in the
TimeSlices because of perspective in perspective projection. An
orthogonal projection mode is used to solve such problems, where the
same nodes in different TimeSlices completely overlap one another.
(a) Normal 3D view
(b) Sliding TimeSlices
(c) Parallel view
Figure 8.5.
Seamless change from 3D view to Parallel view.
6.2 Visualizing Components of Relationships
The components of relationships extracted in Section 5 are visualized by
assigning a colour to a cluster such as “battle” or “gift”, the thickness of an
edge to the frequency of the cluster appearance, and the length of the
coloured edge to the proportion of clusters. Figure 8.6 shows an example
of components of relationships between ODA Nobunaga and TAKEDA
Katsuyori on the annual bases described in Table 8.2.
In the examples shown in Figures 8.6 and 8.8, we use shades of red for
clusters related to “adversarial relationship” or “battle”, shades of blue for
clusters related to friendship, shades of green for other clusters, and gray
for keywords that are not categorized in any clusters. Users can specify
arbitrary groups, categorize clusters to groups, and assign arbitrary colours
to such groups in the current system. Table 8.3 shows an example of such
grouping.
We can also visualize a set of edges arranged on the timeline to
overview changes in relationships between two people every year as
shown in Figure 8.6 and Figure 8.9 by selecting an edge on the network.


Search WWH ::

Custom Search