Information Technology Reference
In-Depth Information
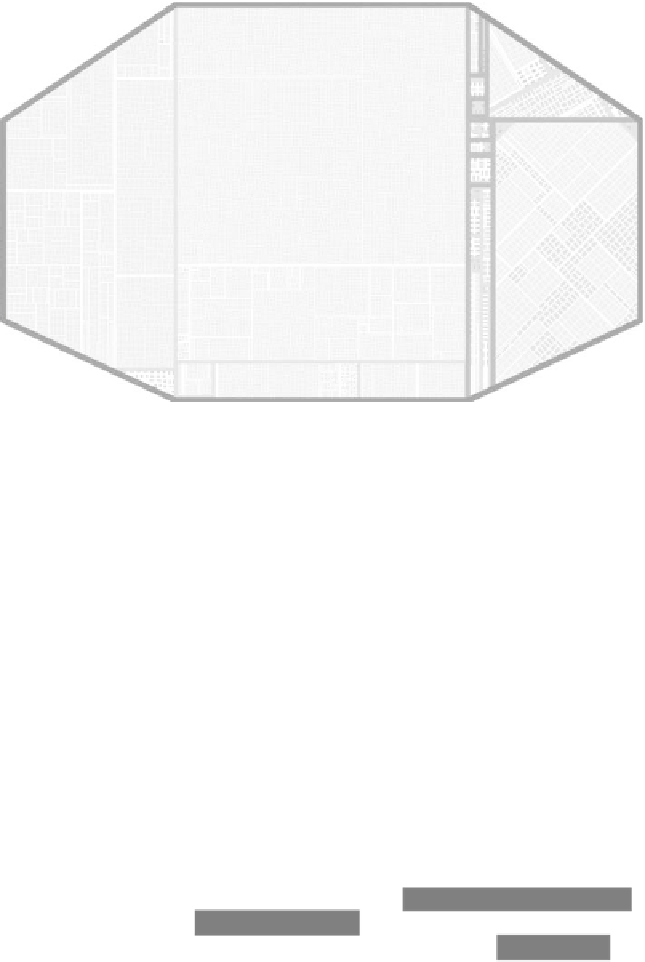
Fig.
5.8.
Container and containment control illustration: a data set with 16,000
nodes using the Angular Treemap algorithm in an octagonal container.
Visual properties
In the application view, visual properties are enhanced in the hierarchical
structure. The graphical properties can be turned on or off and adjusted via
an interactive menu to suit a user's preference of viewing.
Boundary gaps:
A
polygon offset approach is adopted to generate
uniform gaps between the boundaries of polygons which represent either
folders or files. Although boundary gaps sacrifice space, polygon offset
should assist in viewing the structure of hierarchies (see Fig. 5.9).
Colour and edge thickness
: Colour is used to visualize one or more
attributes of each folder or file. This option is useful to represent the
embedded property of the data set. Each colour represents a node type. For
example, in the file system visualization, different colours are brushed to
distinguish the types of files, including documents
(
brown colour
),
multimedia
(
light brown colour
), images (
very light brown colour
),
programming code (
light cyan colour
), system files (
cyan colour
),
compressed files (
dark cyan colour
),
and unknown types (
white colour
).
Search WWH ::

Custom Search