Geology Reference
In-Depth Information
Enter M1: 1.
Enter B1: 1.
Enter M2: 1.1
Enter B2: 1.2
M1,B1,M2,B2 ... 1.000 1.000 1.100 1.200
RV,RH,RV/RH ... 0.1000 0.0100 10.0000
The extrapolation indicates that R
v
= 0.1 with R
h
= 0.01. This is consistent
with computed Receiver 1 data. Consider the column showing R
v
= 0.1 in
Figure 8.9.4. Voltages increase as R
h
decreases, and the assumed value of 0.005
volts is clearly larger than 0.001225. Next consider voltage amplitudes in
Figure 8.9.1c for Receiver 2 and again focus on the R
v
= 0.1 column. Voltages
increase as R
h
decreases, and the assumed value of 0.002 volts clearly exceeds
the 0.0002358 at the top of the column. In summary, we have deduced
anisotropic resistivities R
v
= 0.1 with R
h
= 0.01 ohm-m using the
same
data
available from standard transmitter-receiver measurements.
It is clear from this
example that a single apparent resistivity value will not suffice.
Anisotropy
information, again, is important to production planning and hydraulic fracturing,
an resistivity perspectives can augment sonic and formation testing values for a
more precise and validated view of the reservoir.
8.5 Borehole Effects - Invasion and Eccentricity
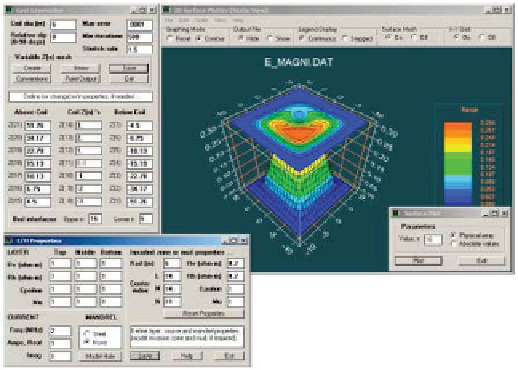
We conclude with a “snapshot” from
Electromagnetic Well Logging
to
show how effects of invasion and borehole eccentricity on electric field are
modeled and displayed (a geometrically shrinking grid is used for plotting
purposes). Again, the approach taken is nondipolar, allowing large coils with
mandrels, as well as multiple dipping anisotropic layers. Readers interested in
details should consult the topic for theory and additional validating examples.
Figure 8.9.6.
High eccentricity with drilling mud invasion.


Search WWH ::

Custom Search