Graphics Reference
In-Depth Information
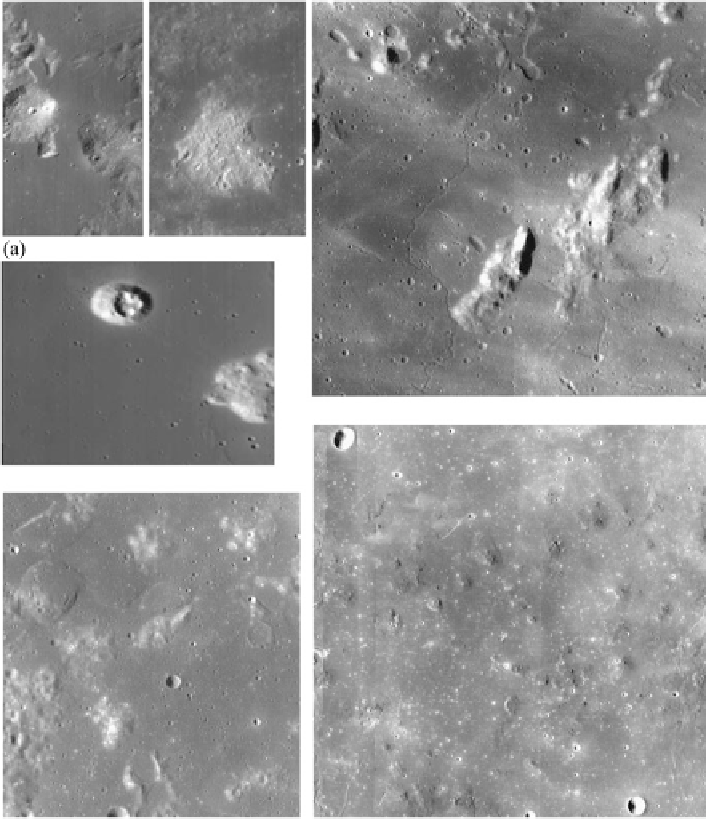
Fig. 8.20
Chandrayaan-1 M
3
and LROC WAC images of lunar mare and highland domes. M
3
image credit: NASA/JPL-Caltech. LROC WAC image credit: NASA/GSFC/Arizona State Univer-
sity. (
a
)M
3
image at 1978 nm wavelength of the Gruithuisen highland domes. (
b
)M
3
image at
1978 nm wavelength of the highland dome Mons Hansteen. (
c
) Mare domes between the craters
Milichius and T. Mayer. Section from the global LROC WAC mosaic. (
d
)M
3
image at 1978 nm
wavelength of the highland domes Mairan T and Mairan 'middle'. (
e
) Lunar domes in Mare Un-
darum. Section from the global LROC WAC mosaic. (
f
) Northern part of the Marius Hills region.
Section from the global LROC WAC mosaic
instrument is provided by Robinson et al. (
2010
). The identification numbers of the
domes in the Marius Hills region shown in Fig.
8.20
f are according to the study of
that region by Lena et al. (
2009
).


Search WWH ::

Custom Search