Graphics Reference
In-Depth Information
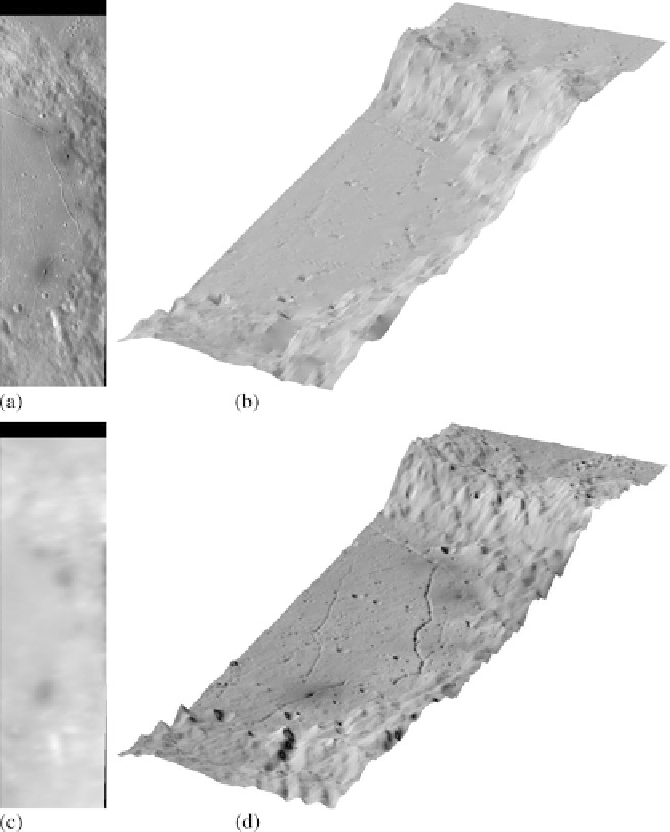
Fig. 8.11
(
a
)M
3
image at 1978 nm of the eastern part of the crater Alphonsus. Image credit:
NASA/JPL-Caltech. (
b
) Perspective view of the LOLA DEM of the region. (
c
) Single-scattering
albedo map at 1978 nm (grey value range 0-0.6). (
d
) Perspective view of the refined DEM, dis-
played with the albedo-dependent modelled reflectance used as an overlay. The vertical axis is
three times exaggerated
ing on a single Chandrayaan-1 M
3
image, but this method nevertheless allows one
to determine a map of the non-uniform surface albedo along with the DEM. The
reflectance model by Hapke (
1981
,
1984
,
1986
) has been used, such that the albedo
values in Fig.
8.11
c correspond to the physical single-scattering albedo, while the
other parameters of the Hapke model were assumed to be constant and were chosen
according to Warell (
2004
). The low-albedo patches are dark lunar pyroclastic de-
Search WWH ::

Custom Search