Graphics Reference
In-Depth Information
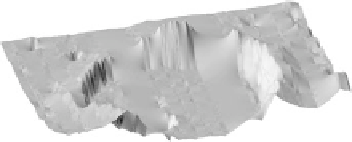
Fig. 8.5
Perspective view of
the LOLA DEM of the crater
Reinhold B from
southwestern direction. The
vertical axis is six times
exaggerated
several images of a surface region under sufficiently different illumination condi-
tions. Hence, telescopic lunar CCD images were used again. Selenographic posi-
tions were obtained from Rükl (
1999
). The three-dimensional reconstruction ap-
proach described in Sect.
5.2
assumes that the grey value
I
of a pixel is proportional
to the incident flux
F
. However, for many cameras it is possible to adjust the gamma
value
γ
manually from within the camera control software, causing the grey value
I
to be proportional to
F
γ
. Hence, a calibration of the gamma scale in the camera
control software was performed by evaluating flat-field frames of different intensi-
ties acquired through different neutral density filters with known transmission co-
efficients, then fitting a characteristic curve of the form
I
aF
γ
=
to the measured
flat-field intensities.
In the scenario of three-dimensional reconstruction of small regions of the lu-
nar surface under roughly perpendicular view and oblique illumination, cos
θ
e
in
the lunar-Lambert reflectance function (
8.6
) hardly deviates from its average value
1, changes in
θ
i
do not significantly influence the value
of the denominator
(
cos
θ
e
+
cos
θ
e
≈
1. Since cos
θ
i
cos
θ
i
)
; thus it can be approximated by the constant
cos
θ
e
+
cos
θ
i
value
(
)
as long as the surface gradients are small. This results
in an effective albedo
ρ
eff
=
2
L(α)
. This approximation is
acceptable for the lunar impact craters regarded here, because the regions examined
in this section are not close to the limb of the lunar disk, and the observed surface
slopes are usually smaller than about 10
◦
. Furthermore, the average depth devia-
tion between the surface profile computed with a lunar-Lambert reflectance func-
tion from the Lambertian solution is always well within the error range of shadow
analysis in the example scenes. In the examples of Fig.
8.6
a, the root-mean-square
deviation is smaller than 40 m for
L(α)
in the range
ρ
[
cos
θ
i
+
1
−
L(α)
]
cos
θ
e
+
0
.
1
,...,
1. If, however, the
surface is imaged under a more oblique viewing angle, as is the case for some of
the lunar domes regarded in Sect.
8.4
, it is important to fully take into account the
lunar-Lambert reflectance function.
For each examined crater, the obtained surface profile is checked by Wöhler and
Hafezi (
2005
) for consistency with the image data by means of a ray tracing soft-
ware. The appearance of the surface profile under solar elevation angles
μ
(shading
image) and
μ
shadow
(shadow image) is simulated assuming a Lambertian surface.
For all examples, both simulated images are satisfactorily similar to the correspond-
ing real images. A good cross-check is provided by the rendered shadow image due
to the fact that the shape of the simulated shadow is highly sensitive with respect to
small deviations of the surface profile from the correct shape. Additionally, we have
shown (see the beginning of Sect.
5.2
) that the quality of reconstruction is hardly
affected by inaccurate knowledge of the reflectance function.
−

Search WWH ::

Custom Search