Graphics Reference
In-Depth Information
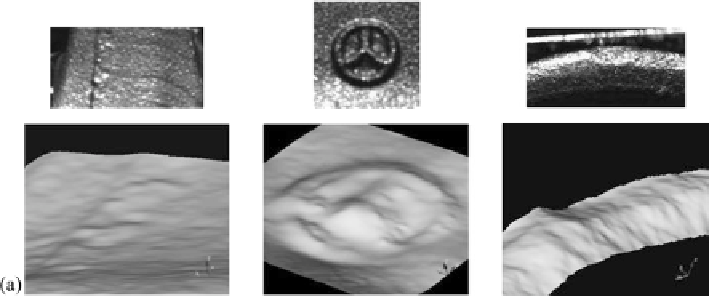
Fig. 6.25
Close-up views of the three-dimensional surface profiles in comparison to the input
images. (
a
) Small positive relief structures
(
1
,
3
,
4
)
and a depression (2) on the surface of the
connection rod. (
b
)Lowparts
(
1
,
2
,
3
)
and ridges
(
4
,
5
,
6
)
of the star pattern. (
c
) Small depression
on the surface of the ring-shaped flange
larisation angle data from camera 1 is compared to the result obtained without po-
larisation data, exclusively relying on intensity and stereo information. We found
that neglecting polarisation data leads to an under-estimation of the surface slopes
in the direction perpendicular to the illumination direction, such that details like the
bending in the leftmost part of the flange surface in Fig.
6.24
c tend to disappear.
This effect is due to the illumination by a single light source (Horn,
1989
). These
results illustrate that the pixel grey value
I(u,v)
and the polarisation angle
(u, v)
contain complementary information about the surface gradients
p(u,v)
and
q(u,v)
,
which is the main reason why a better three-dimensional reconstruction is achieved
when intensity and polarisation angle information is used.
Figure
6.25
shows close-up views of the three-dimensional surface profiles in
comparison to the input images, clearly indicating that mesoscopic and macroscopic
structures which appear as dark and bright spots in the input images can be recon-
structed. Figure
6.25
a displays several small positive relief structures (1, 3, 4) and
a depression (2) on the surface of the connection rod. In Fig.
6.25
b the low parts
of the star pattern are indicated by 1, 2, and 3 and the ridges by 4, 5, and 6. Fig-
ure
6.25
c illustrates how the specular stereo method recovers a shallow depression
on the surface of the ring-shaped flange (cf. also Sect.
6.3.4.2
).
6.3.4.2 Comparison to Ground Truth Data
For the connection rod example a highly accurate reference profile was measured
with a laser profilometer for a cross section of the surface, as indicated in Fig.
6.26
.
The root-mean-square deviation between the result of the specular stereo method
and the ground truth amounts to 55
m, which is somewhat smaller than the average
lateral extension of the image pixels of 86
μ
μ
m.


Search WWH ::

Custom Search