Biomedical Engineering Reference
In-Depth Information
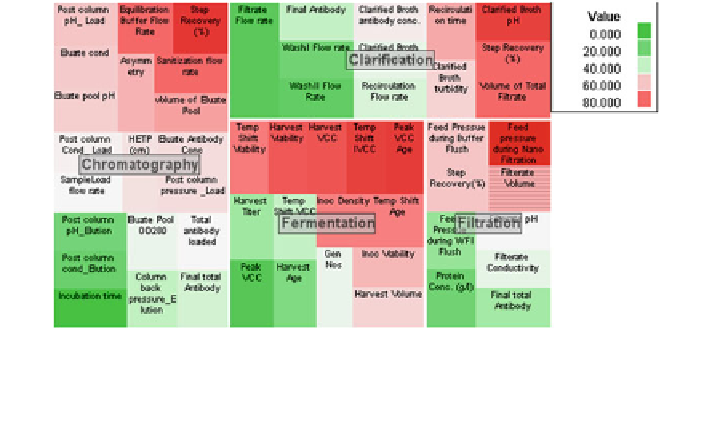
Fig. 12 Treemap representing parameter values of four steps of a process for a single batch.
Each coloured rectangle represents a parameter. The colour is scaled from red to green, where
red indicates that the parameter value is approaching the upper alert limit and green indicates that
the value is approaching the lower alert limit
control and the multivariate analysis approach to understand the bioprocess vari-
ability and relationships between different parameters. In basic visual monitoring
tools (described in the previous subsection) the focus is easier detection of unusual
trends and patterns in the data to enable troubleshooting, whereas the focus for
statistical monitoring tools is to provide a quantitative measure of the inherent
variability in the process, assess the current state of control and enable process
improvement.
The various tools that are used for statistical monitoring are:
• Univariate control charts.
• Multivariate control charts.
Among such statistical monitoring tools, univariate control charts are the most
basic and widely used tool for monitoring process performance. These charts are
used to monitor whether or not the process is in control (where the sources of
variation are common). Analysis of such charts can provide an indication
regarding when a particular cause occurred (if any) resulting in the process going
out of control.
Univariate control charts plot a single parameter in one display where the Y-axis
represents the value of the parameter for the corresponding batches on the X-axis.
The data points for all the batches are then connected with a line that shows the
trend of the values for that parameter. A centreline is drawn based on the average
of the parameter values. Two lines (one above and one below the average line)
represent the statistical limits of the process that are calculated based on
±3 standard deviations (SDs). The statistical limits are the bounds for the
parameter, where a value inside this region signifies that the variability in the
process is due to inherent variability of the process (i.e. the process is in control)
Search WWH ::

Custom Search