Biomedical Engineering Reference
In-Depth Information
0.09
AJA018_2.5hours
AJA018_3hours
0.08
0.07
0.06
0.05
0.04
0.03
0.02
0.01
0
1
10 19 28 37 46 55 64 73 82 91 100 109 118 127 136 145
Mass (m/z)
Fig. 7 Comparison of PyMS data from the same cultivation using two consecutive time-point
samples in blue and red colour
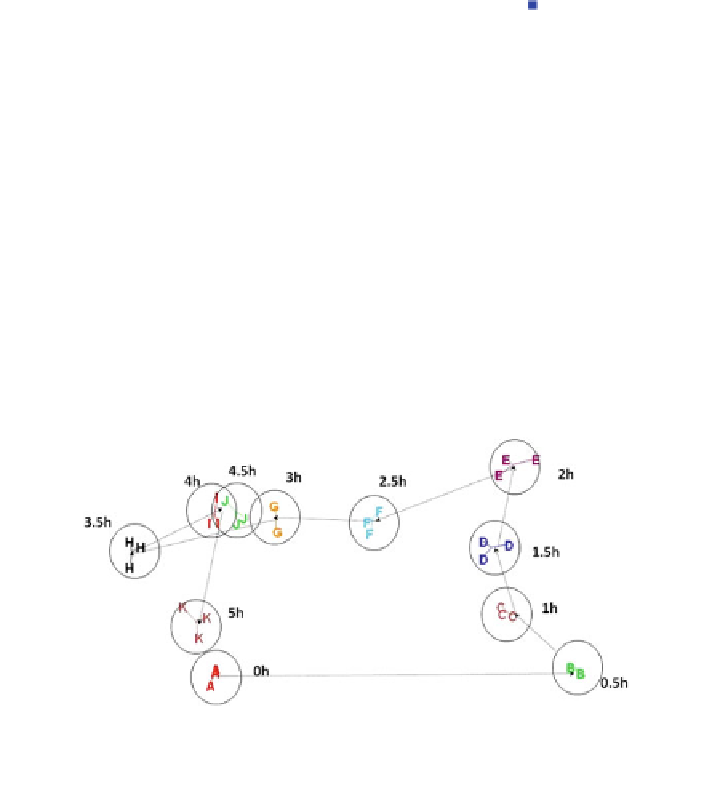
Fig. 8 Clustering of data from a recombinant E. col cultivation. Triplicates of individual time-
point samples are represented by full circles and connected by lines. Each of the triplicates is
additionally labelled to indicate the fermentation and time post-inoculation
Each PyMS data file consists of 150 mass to ion charge (m/z) data reflecting the
composition of the sample. Triplicates of each of the samples were analysed using
PCA-CVA to minimise the variance between the triplicates (within-group
variance) and to maximise the variance between the individual time-point samples
(between-group variance). The results are shown in Fig.
8
.
Finally, for an online application of PS inferential estimation and control, as
proposed in Fig.
9
, methods capable of assigning online data into individual PSs
without relying upon the time-consuming and often un-economical offline analyses
have to be developed.


Search WWH ::

Custom Search