Biomedical Engineering Reference
In-Depth Information
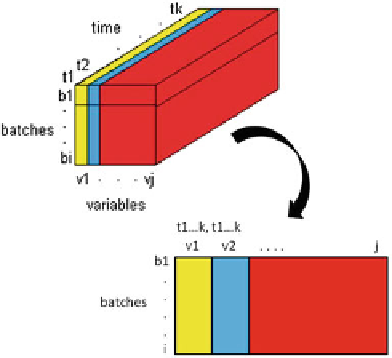
Fig. 2 Multiway
decomposition of a typical
3D bioprocess data array
consisting of time trajectories
of various variables for a
range of batches resulting in a
2D matrix with indicated
dimensions
3.2.2 PCA-Based Feature Extraction Case Study
In an unsupervised mode, PCA can reveal similarities between individual
bioprocessing batches, although a more frequent application is the detection of
deviation from 'nominal' or expected process behaviour. In this type of applica-
tion, historical examples of data representing 'nominal' or desired behaviour (e.g.
high concentration or quality/purity of desired product) are used together with
examples of process data deviating from this behaviour. Interrogation of score
plots may reveal the reason for the deviation between the batches, thus furthering
process understanding and enabling more effective process control and operation.
Figure
3
illustrates an example of a bivariate plot of the scores resulting from a
multivariate PCA analysis of historical process data collected during a typical
recombinant monoclonal antibody fragment production cultivation, with typical
online and offline measurements collected during the cultivations. In this particular
model 7 online variables, including pH, dissolved oxygen concentration and
temperature, and 13 design variables (whose values are changed during process
development) were used. Note that each batch is represented by a single symbol on
the plot. Given that the results, in terms of product concentration, are known at the
time of the analysis, it is possible to represent each high-producing batch in one
colour (in this case red) and low-producing batches in a different colour (green in this
case).
Figure
3
illustrates potential issues with the interpretation of the results.
A researcher may believe they achieved a very good clustering and be tempted to
draw arbitrary clusters A and B as indicated in Fig.
3
. However, when the same
figure is re-drawn with a different colour scheme, this time using black colour for
feed composition 1 (one of the design variables) and red for feed composition 2,
there is a much better separation, with one type of batch (high and low producing)
contained at the left-hand part of Fig.
4
while cultivations carried out with feed
composition 2 lie entirely at the right-hand side of the figure. Note that the
Search WWH ::

Custom Search