Biomedical Engineering Reference
In-Depth Information
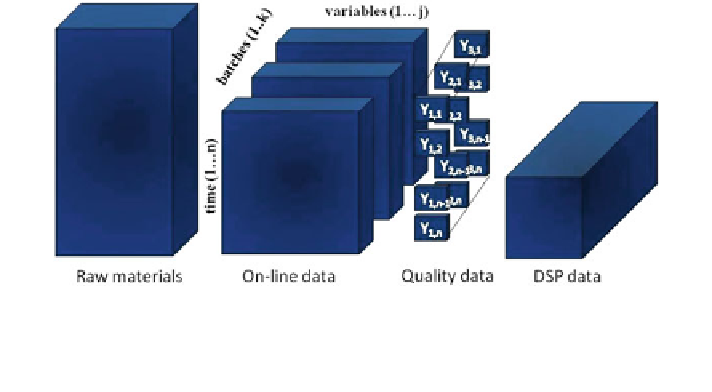
Fig. 1 Typical data structures collected during bioprocess operation, highlighting the different
frequencies of data collection and discrete character of the quality data as well as the online data
array structure resulting from the collection of measurements for a number of variables over time
from a number of batches
The batch character of the data typically collected from bioprocesses, as indicated
in Fig.
1
, introduces additional non-linearities that a number of researchers claimed
must be addressed by modified PCA approaches. There are a range of non-linear
variants of PCA, including kernel PCA [
50
] and principled curves and surfaces [
52
],
the mathematical principles of which are reviewed in Yin and Huang [
64
].
An alternative approach to addressing the issue of non-linearity is the batch
transformation, termed multiway PCA, initially proposed by Wold et al. [
61
]. Since
then, other authors have adopted the approach and applied the method to a number of
processes [
40
]; for example, Gregersen and JØrgensen [
16
] investigated the detec-
tion of faults in a fed-batch fermentation process, and Kompany-Zareh [
24
] used this
methodology for online monitoring of a continuous pharmaceutical process.
The multiway technique re-arranges the data into a two-dimensional matrix as
demonstrated in Fig.
2
. As also indicated in the figure, a number of possibilities
exist when unfolding the array, with batch-wise decomposition (horizontal slice in
Fig.
2
) being the more traditional method.
The case study demonstrated in this chapter is based on this alternative
unfolding approach, resulting in a matrix of size (i 9 kj), where each row repre-
sents one batch (and thus is represented by a single symbol in the principal
component plots, see Figs.
3
and
4
). The first j columns represent the time tra-
jectory of the first variable. The next j columns represent the second variable, and
so on. Thus when the data are normalised by subtracting the mean and dividing by
the standard deviation at each sample point, the deviations from the mean tra-
jectory are investigated and the major source of the non-linearity (due to the batch
mode of culture growth not attaining a steady state) is eliminated.
It should be noted that there are a range of alternative methods, such as parallel
factor analysis (PARAFAC) and trilinear decomposition (TLD) [
24
], that have
been successfully used in the analysis of data array structures illustrated in Fig.
2
,
but these are outside the scope of this text.
Search WWH ::

Custom Search