Biomedical Engineering Reference
In-Depth Information
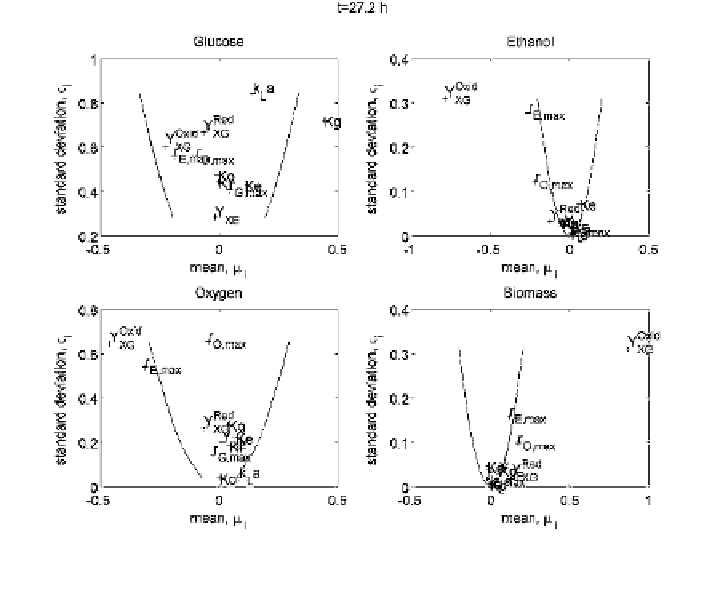
Fig. 12 Elementary effects during growth phase on ethanol: estimated mean and standard
deviation of the distributions of elementary effects of the 11 parameters on the model outputs.
The two lines drawn in each subplot correspond to Mean
i
2sem
i
(see text)
During growth on glucose (Fig.
11
) only a few parameters show a significant
effect on the model outputs. While Y
X
Oxid
seems to have a nonlinear effect on the
glucose prediction, r
G,max
has a linear one. The effects of other parameters are
mostly nonlinear, as expected given the structure of the model used in the
example. The former parameter has also a significant effect on oxygen and bio-
mass, while the latter parameter has a significant effect on ethanol.
With regard to results for a time point during growth on ethanol, it is important
to note that Y
X
Oxid
appears to have a significant effect on the ethanol, oxygen, and
biomass predictions, although the glucose has been depleted. This may reflect the
impact of the biomass concentration (originated during the prior growth on glu-
cose) on the total amount of ethanol produced, as well as its consumption and the
consumption of oxygen for the observed time point.
There is good agreement of the results of the Morris analysis with the previ-
ously presented SRC ranking obtained for the linear regression method. In Figs.
11
and
12
, the parameters most distant from the wedge are the parameters ranked as
the most influential on the model outputs (Table
9a
,
b
).
Search WWH ::

Custom Search