Biomedical Engineering Reference
In-Depth Information
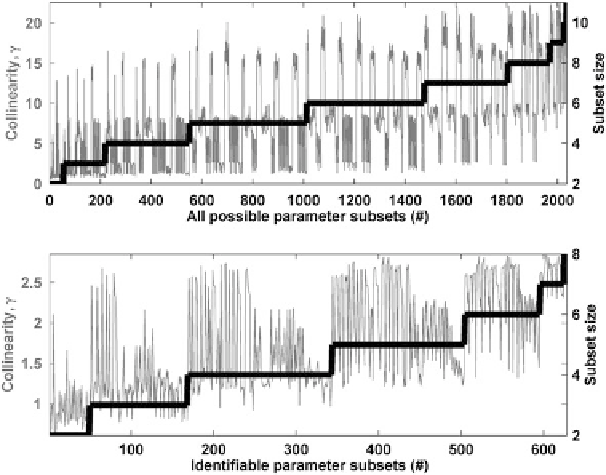
Fig. 3 Collinearity index and size corresponding to parameter subsets of increasing size. The top
plot refers to all the parameter subsets evaluated in the analysis, whereas the bottom figure refers
exclusively to the subsets that complied with the a priori defined collinearity threshold
The collinearity between the uptake rates and the yield coefficients explains
why, even though they are the parameters with greatest importance for the model
outputs (Fig.
2
), they are not all included in the identifiable parameter subsets.
2.3 Parameter Estimation
Two datasets corresponding to two replicate batch fermentations of S. cerevisiae
were available. For further details on the experimental data collection methods the
reader is referred to the work of Carlquist et al. [
19
]. The dynamic profiles of
glucose, ethanol, and biomass (as optical density, OD) were available for the two
datasets, while oxygen data were only available for one of them. The OD mea-
surements were converted into biomass dry weight (DW) values using a previously
determined linear correlation (DW = 0.1815 9 OD).
The parameters in the ''best'' identifiable subset were estimated by minimization
of the weighted least-square errors. The weights for each variable i were defined by
w
i
¼
1
.
sc
ð
2
, and the scaled factors (also used in Eq.
9
) were defined as the mean of
the experimental observations for each given variable. The estimation was done
simultaneously for the two datasets. The new estimates of the identifiable parameters
Search WWH ::

Custom Search