Biomedical Engineering Reference
In-Depth Information
1000
950
900
850
800
: β-TCP
: HAp
750
0
0.2
0.4
0.6
0.8
1.0
1.2
Molar ratio of Ca and P precursor,
R
Ca/P
FIGURE 7.24
CVD phase diagram of Ca-P-O coatings prepared at
P
L
= 50 W and
P
tot
= 0.6 kPa.
HAp coatings were obtained at 800 to 900 K and Ca/P molar ratios more than 0.4, while
single-phase β-TCP coatings were obtained around 950 K and at Ca/P molar ratios less
than 0.4. The deposition temperature for HAp by laser CVD was about 200 K lower than
that by thermal CVD. The preferred orientation was controlled mainly by the changing
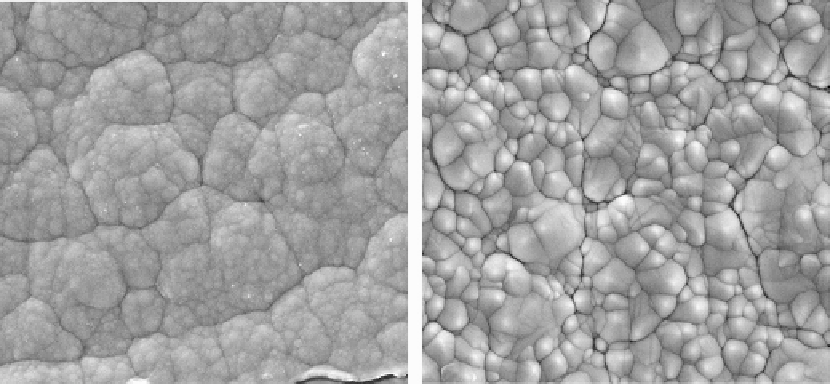
Ca/P molar ratio. Typical surface morphologies of (002)- and (300)-oriented HAp coatings,
respectively, are presented in Figure 7.25a and b. β-TCP coating prepared at a laser power
of 100 to 200 W also showed preferred orientations of (290) and (400). The surface morphol-
ogy of β-TCP coatings prepared at Ca/P molar ratios of 0.4 and 0.7 about 1320 to 1330 K,
respectively, is presented in Figure 7.26a and b, where the (290) orientation of Figure 7.26a
is slightly more prominent than that of Figure 7.26b. The deposition rate for Ca-P-O
(a)
(b)
5 µm
5 µm
FIGURE 7.25
Surface morphology of (a) (002)-oriented and (b) (300)-oriented HAp coatings prepared by laser CVD.


Search WWH ::

Custom Search