Biomedical Engineering Reference
In-Depth Information
(a)
(b)
B
D
C
A
P
θ
E
500 μm
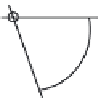
FIGURE 6.28
(a) Schematic apparatus of particle erosion test and (b) surface morphology of SiO
2
erodent.
A
,
compressed air
flow;
B
,
erodent supplier;
C
,
erodent nozzle with 6-mm inner diameter;
D,
specimen, 30 mm from the nozzle
outlet;
E
,
specimen holder;
θ
,
impact angle;
P
, pressure gauge.
Figure 6.28a. Details of its function have been well described in the reports [234,235]. For
the case of present experiments herein, the erosion test specimens are surface finished by
grinding with 1200-grit SiC papers before conducting the particle erosion test. Angular
SiO
2
grit with mean particle size of 295 ± 10 μm is selected as the erodent, as shown in
Figure 6.28b. The pressure of compressed air flow is set at 0.3 MPa, and the average particle
velocity, which is estimated from single-exposure photography, was about 73 m s
−1
. The
total erodent weight is fixed at 300 g for each run. These above-mentioned erosive wear
experimental parameters can be changed with the practical situations. The impact angle
can be varied from 15° (an oblique impact) to 90° (a normal impact) through rotating the
specimen holder. The erosion rate, which is defined as the total weight loss per erodent
weight, is taken directly as the total weight loss divided by applied total erodent weight.
Figure 6.29 shows the particle erosion test results and the representative wear surface
morphologies. These data are averaged from at least two runs for each test condition
(from 15° to 90°). It can be seen that the erosion rate signifi cantly increased with increas-
increased with increas-
ing the erosion impact angle for plasma-sprayed HACs. Figure 6.29a shows the wear
surface of plasma-sprayed HACs that displays a sliding fracture path along the erodent
° to 90°). It can be seen that the erosion rate signifi cantly increased with increas-
to 90°). It can be seen that the erosion rate signifi cantly increased with increas-
°). It can be seen that the erosion rate signifi cantly increased with increas-
). It can be seen that the erosion rate signifi cantly increased with increas-
. It can be seen that the erosion rate signifi cantly increased with increas-
It can be seen that the erosion rate signifi cantly increased with increas-
the erosion rate signifi cantly increased with increas-
signiicantly increased with increas-
As-sprayed HACs
AH600
HT150
(b)
(a)
7.5
(c)
20 µm
5.0
20 µm
(d)
20 µm
2.5
20 µm
0.0
15
30
45
60
75
90
Erosion impact angle (
θ
)
FIGURE 6.29
Variability of erosion rate with erosion impact angle for plasma-sprayed HACs, applied with atmospheric heat
treatment at 600°C (AH600) and hydrothermal treatment at 150°C (HT150). Corresponding wear surface mor-
phologies of as-sprayed HACs at impact angles of (a) 15° and (b) 90° and wear surfaces of (c) AH600 and (d)
HT150 specimens at 90° normal impact angle are displayed. Arrow indicates projected impact direction of
erosion test.


Search WWH ::

Custom Search