Biomedical Engineering Reference
In-Depth Information
0.70
Holding stage
600ºC
Heating stage
0.35
0.00
Cooling stage
800ºC
400
º
C
500
º
C
600
º
C
700
º
C
800
º
C
-0.35
50 µm
-0.70
200
400
600
800
Temperature,
T
(
º
C)
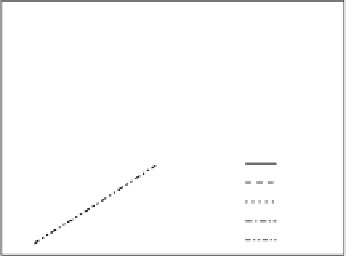
FIGURE 6.11
Dilatation curves of plasma-sprayed HACs obtained from heating, holding to cooling processes at 400°C to
800°C. (From Yang, C.W. and Lui, T.S.,
Mater. Trans
., 48(2), 211-218, 2007. With permission.)
an approximately linear thermal expansion when the heating temperature is in the range
from 100°C to 400°C. The CTE of an HAC within this temperature range is also evaluated
for about 15.6 × 10
−6
°C
−1
. In addition, it is worth noting that the nonlinear region of the
dilatation curves represents a consequence of greater crystallization of plasma-sprayed
HACs at 500°C to 800°C temperature interval. Table 6.1 lists the extent of dilatation val-
ues that are calculated from the dilatation curves cooling to about 100°C and significant
crystallization-induced contraction after heat treatments have been demonstrated. This
phenomenon can be recognized as a result of crystallization-induced contraction for these
coatings. The CTE data of crystallized HACs at these heating temperatures are calculated
from the slope of cooling stages, and the change in the CTE value also means that the effec-
s, and the change in the CTE value also means that the effec-
tive crystallization temperature of plasma-sprayed HACs by postheat treatments should
be higher than 600°C [64,120].
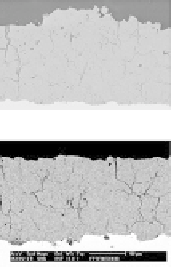
Compared with the as-sprayed HACs (Figure 6.6b), the cross-sectional images obtained
from 600°C and 800°C crystallized HACs represent significantly cracking features, as indi-
cated by the arrows in Figure 6.11. Figure 6.12 shows a typical SEM/SEI observation nearby
these contraction-induced cracks of the heat-treated HACs in the range of 600°C to 800°C,
and there is an obvious contrast within this area. Through the semiquantitative analysis of
SEM/EDS, the light gray contrast denoted by “C” with a Ca/P ratio of 1.61 represents the
occurrence of HA crystallization close to the contraction-induced cracks, and the dark gray
stages, and the change in the CTE value also means that the effec-
TABLE 6.1
Coefficient of Thermal Expansion (CTE, α) and Crystallization-Induced Contraction Ratio of
Heat-Treated HACs
HeatingTemperatures(°C)
α(×10
−6
°C
−1
)
a
ContractionRatio(%)
b
400
15.1
0.05
500
14.8
0.20
600
13.6
0.28
700
13.9
0.43
800
14.3
0.65
Source:
Yang et al.,
Mater. Trans
., 48(2), 211-218, 2007. With permission.
a
Values are measured from the slope of cooling curves to room temperature.
b
Data obtained from total dilatation of the sample dimension after cooling.


Search WWH ::

Custom Search