Biomedical Engineering Reference
In-Depth Information
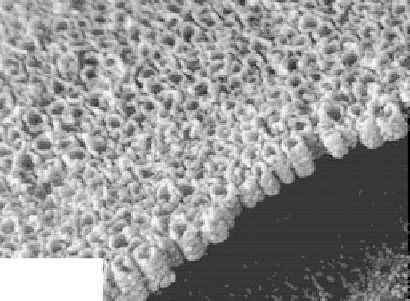
200 nm
FIGURE 5.2
SEM micrograph of first-generation nanotubes on surface and cross section. (From Gong et al.,
J. Mater. Res.,
16,
3331-3334, 2001. With permission.)
electrolyte. The typical surface and cross-sectional morphologies are depicted in Figure 5.2
(Gong et al. 2001). Recently, Allam and Grimes (2008a) reported successful fabrication of
titania nanotubes 2.5 μm long by using an Fe cathode. The second-generation fabrication
feature increased nanotube lengths to several micrometers and growth rates of around
0.25 μm/h. This is accomplished by adjusting the pH of both the aqueous KF and NaF elec-
trolytes to reduce the chemical dissolution rate of oxide (Michailowski et al. 2001). The rep-
resentative morphology of these second-generation titania nanotube arrays is displayed in
Figure 5.3. The third-generation synthesis employs organic electrolytes such as ethylene
L
= 1.5
µm
100 nm
100 nm
FIGURE 5.3
Lateral and cross-sectional views of second-generation titania nanotubes. (From Cai et al.
, J. Mater. Res.,
20,
230-236, 2005. With permission.)


Search WWH ::

Custom Search