HTML and CSS Reference
In-Depth Information
Next, you need to create a placeholder element in your page, into which flot will render
the
canvas
graph. The flot library will automatically match the bitmap rendered di-
mensions of the
canvas
element to the size of the placeholder element that you specify:
<div id="my_graph" style="width:600px; height:300px"></div>
Now, you need to set up the data that you will plot onto your graph. You can either
load this data dynamically, using Ajax, or include the data inline in your script code,
as shown here:
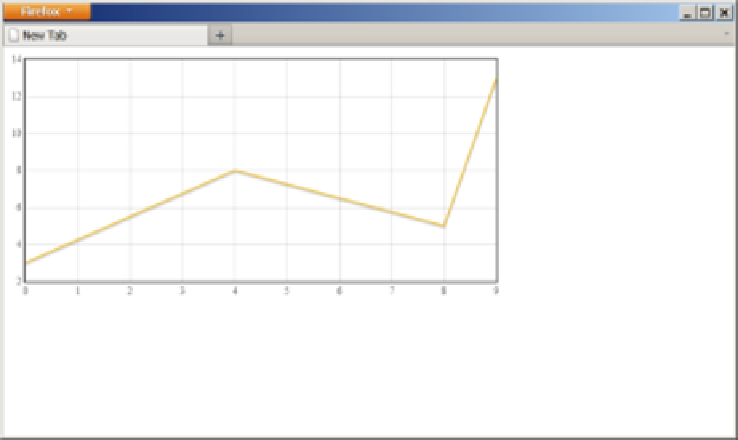
var graph_data = [[0, 3], [4, 8], [8, 5], [9, 13]];
The format of the data is an array of [
X
,
Y
] pairs for each data point, representing values
for the x- and y-axes for each point, respectively.
Once you have the graph data, if the default graphing options are acceptable, simply
call the flot graphing API directly, passing it your data:
var my_graph = $("#my_graph"); // get a reference to the placeholder
$.
plot
(my_graph,
[graph_data]
); // pass the graph data as one data series
You will notice that we passed the graph data inside
[]
, meaning we actually passed
an array wrapped around our graph data. The flot graphing API supports graphing
multiple data series at a time on one graph. In our example, our graph data was only
one such data series, but you could pass other data series as desired. The default options
and styles will result in a nice-looking graph, as shown in
Figure 9-18
.
Figure 9-18. Using flot to graph some data with a <canvas> element