Information Technology Reference
In-Depth Information
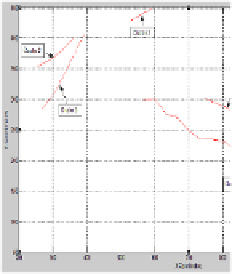
4.3.2 Results for Animal
Figure 5 represents the Qua
for each run for both animal
From Figure 5, for the
Quality Measure reached is
optimum Quality Measure r
Movement Data Sets
lity Measures as the values for eps and MinLns are chan
l movement data sets.
elk movement data set, it is obvious that the minim
s at eps= 49-52 and MinLns=10. For the deer data set,
reached is at eps=30 and MinLns=6.
nged
mum
the
Fig. 5
5.
Quality Measure for Elk and Deer Data
Figure 6 represents the o
for the Elk data on the left
data set is carried out at ep
set is carried out at eps=30 a
Tables 2 summarize the
cluster with the highest d
trajectories in it and the av
the cluster with the high
sub-trajectories in it and an
output clusters resulting from carrying out the optimum r
t and Deer data on the right. The optimum run for the
ps=52 and MinLns=10. The optimum run for the Deer d
and MinLns=6.
temporal data for both animal data set runs. In Table 2,
density of line segments is Cluster 1. It has 3036 s
erage segment time in that cluster is 7.4 hours. In Tabl
hest density of line segments is Cluster 1 with 1
average segment time of 5.93 hours.
runs
Elk
data
the
sub-
le 3
551
Fig. 6.
Clust
tering results for Elk and Deer Data respectively


Search WWH ::

Custom Search