Information Technology Reference
In-Depth Information
4.3
Experiments
This section represents numerous numbers of runs on all three data sets mentioned to
test the validity of the proposed algorithm. To measure cluster validity, a Quality
Measure was calculated for each run. This Quality Measure is the Sum of Squared
Error, added to that, a noise penalty to penalize incorrectly classified noise [7].
Quality Measure = Total SSE + Noise Penalty
=
∑
||
∑∑,,,
+
∈
∈
(4)
||
∑∑,,,
.
∈
∈
Where:
X and Y are line segments that belong to cluster C
i
N are the noise segments not belonging to any cluster
The goal of this study is to find the best run for each data set which minimizes the
value of the Quality Measure while at the same time gives a reasonable number of
clusters to represent the data.
The values of the time penalty factor and the time window are fixed for all runs.
The time penalty factor K
t
is set to 1, assigning 100% importance to the time factor.
Time window
is set to 0, assigning zero time tolerance between trajectories.
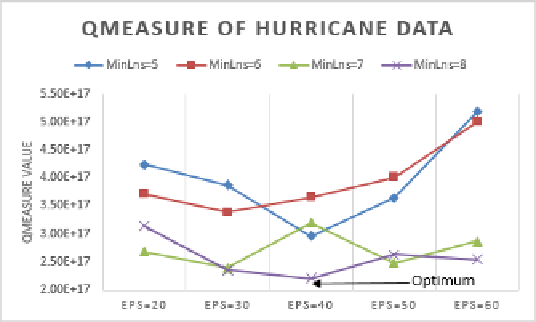
4.3.1 Results for Hurricane Data Set
Figure 3 represents the Quality Measure as the value for eps and MinLns are changed
for each run for the Hurricane data set. In Figure 3 the runs carried out are for a broad
range of eps, ranging from 20 - 60. After carrying out several runs, it is noticed that the
best results range from MinLns = 5 - 8. As seen in figure 3, the optimum run that gives
the least Quality Measure is at eps=40 and MinLns=8.
Fig. 3.
Quality Measure for Hurricane Data


Search WWH ::

Custom Search