Information Technology Reference
In-Depth Information
In table 4 are represented the general statistical results concerning to the
questionnaires for each interviewed. As can be seen, the average of responses
obtained is around the 3 points. However, by observing dispersion measures, standard
deviation (Stand.dev) and coefficient of variation (Coeff.var), it becomes clear the
great dispersion or variability of responses obtained.
Table 4.
Analysis of Global Results
1
2
3
4
5
6
7
8
9
N
81
81
81
81
81
81
81
81
81
Min
1
1
2
2
1
1
1
2
1
Max
6
6
5
4
6
6
6
6
5
Sum
242
276
315
262
270
299
224
280
298
Mean
2,988
3,407
3,889
3,235
3,333
3,691
2,765
3,456
3,679
Stand.dev
1,374
1,126
0,851
0,746
1,025
0,816
0,978
1,001
0,985
Coeff.var
45,983 33,066 21,894 23,069 30,741 22,109 35,371 28,946 26,779
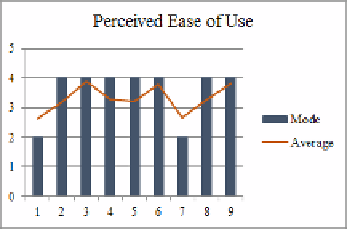
For a better perception of the responses made by each interviewed, an analysis was
performed (average and mode) per person questioned and TAM construct (Figure 1 to
4). In this analysis the people (x-axis) are represented by numbers (1 to 9). In a higher
level of analysis it is possible to observe that the seventh person answered most
questions with 2 points and the average of the responses is between 2 and 3 values.
This means that there are a number of aspects of the system with which the
interviewed is not satisfied. In addition, it is possible to observe, in figures 1 and 3,
that the first interviewed responded mainly the questions with the evaluation of 2
points, however, the average is between 3 and 4 points. This means that this person is
very pleased with some aspects of the system but not so much with others. In a global
analysis the evaluations are above 3 points.
Fig. 1.
Evaluation PU
Fig. 2.
Evaluation PEOU


Search WWH ::

Custom Search