Information Technology Reference
In-Depth Information
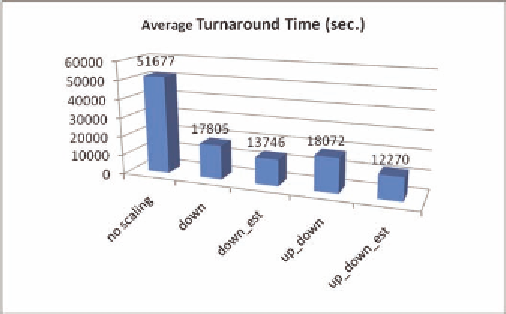
Figure 1. Performance comparison of moldable job allocation policies
at that moment is larger than the number
of free processors. The system has two
choices for scheduling the job: scaling its
parallelism down for immediate execution
or keeping it waiting in queue. According
to the estimated execution time of the job,
the system can compute the job's enlarged
execution time once scaling down its par-
allelism. On the other hand, based on the
estimated execution time of each job run-
ning on the system, it is possible to pre-
dict how long it will take for the system to
gather enough free processors to fulfill the
original requirement of the job. Therefore,
the system can compare the resultant per-
formances of the two choices and choose
the better one. We use a threshold variable
to control the selection between the two
choices. The system chooses to scale down
the job's parallelism for immediate execu-
tion only if threshold × To > Tsd, where To
is the predicted turnaround time if the job
waits in queue until enough free proces-
sors are available and Tsd is the predicted
turnaround time if the job run immediately
with reduced parallelism.
automatically scales a parallel job's paral-
lelism up to use the amount of total free
processors even if its original requirement
is not that large. However, to avoid a sin-
gle job from exhausting all free processors,
resulting in subsequent jobs' unnecessary
enlarged waiting time in queue, the policy
scales a parallel job's parallelism up only if
there are no jobs behind it in queue. This is
why it is called conservative.
Figure 1 shows the performance evaluation of
various allocation policies where
•
no scaling. No adaptive scaling.
•
down. Adaptive scaling down without run-
time estimation.
•
down_est. Adaptive scaling down with
runtime estimation.
•
up_down. Conservative scaling up and
down without runtime estimation.
•
up_down_est. Conservative scaling up and
down with runtime estimation.
For the adaptive policies with runtime esti-
mation, we experimented with several possible
threshold values and chose the best result to present
in Figure 1. For the adaptive scaling down policy,
the best threshold value is 2.1 and the conserva-
•
Conservative scaling up and down. In ad-
dition to the scaling down mechanism de-
scribed in the previous policy, this policy
Search WWH ::

Custom Search