Geography Reference
In-Depth Information
He il on gj iang
Ji li n
Inner Mongolia
Li aonin g
Beij in g
Ti an ji n
He be i
He be i
Shanx i
Ningxia
Shaanxi
Shand on g
Ga ns u
Ga ns u
Qi ngha i
He na n
Ji angs u
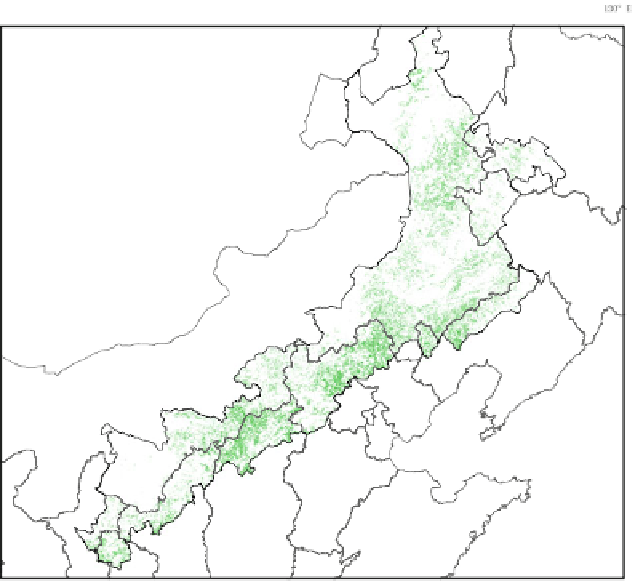
Fig. 3.11
The distribution of Cropland/Natural vegetation mosaics in 1 km grid all over North
China
forest, deciduous needle-leaf forest, deciduous Broadleaved forest and mixed
forest based on the ancillary data in 2000.
The degree of overlap between any two land cover classes based on the feature
definitions of the classification schemes is used to select sample grids among the
IGBPDIS, WESTDC, UMD and GLC data (Ahlqvist
2008
). The degree of agree-
ment for each grid is determined by the overlap metric, which indicates the feature-
based similarity among different land cover products. If the classes of two products
are identical or mostly overlapped for a given grid, then the grid will be assigned a
value of 1, which indicates that the two classes of different classification schemes
completely agree with each other. Otherwise, the grid will be assigned a value of 0.
Finally, agreement and disagreement maps will be created over the entire region,
which highlight areas that have a high confidence of classification (Fig.
3.12
). In
other words, the sample grids could be selected from the agreement degree maps.
In this study, the method improves the classification results by further applying
the data mining technique and using ancillary information. The detailed DEM
data, NDVI, NPP and meteorological data were utilized as ancillary information to
separate those vegetation classes, the ecological characteristics of are very dif-
ferent. The vegetation types are closely related to physiographic factors and