Geography Reference
In-Depth Information
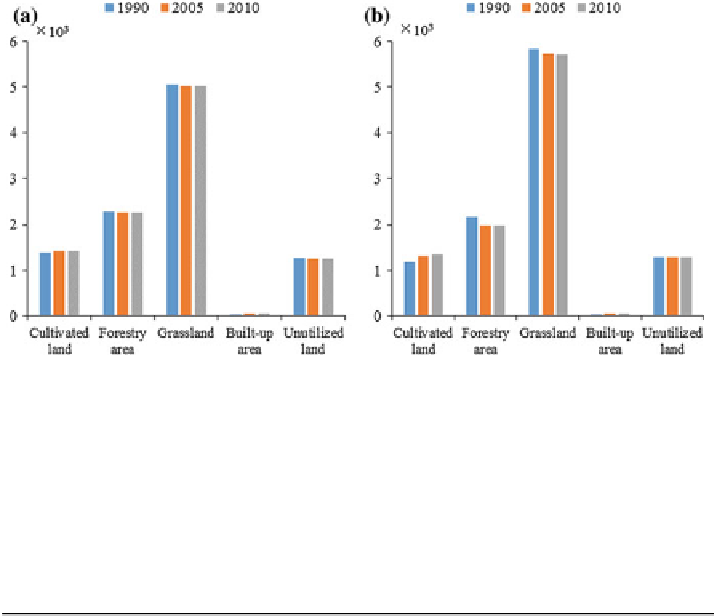
Fig. 3.1 Comparison of simulated land use and real land use; a the real land use area in 1990,
2005 and 2010; b simulated land use area in 1990, 2005 and 2010 (1,000 km
2
)
Table 3.4 Simulation accuracy (%) of land use allocation
Cultivated
land
Unutilized
land
Forestry
area
Grassland
Built-up
area
Average
error
Total average
error
1990
-14.63
-5.06
15.61
-12.72
1.74
9.95
8.67
2005
-7.50
3.23
-12.35
14.03
-2.85
7.99
2010
-5.21
2.93
-12.56
13.75
5.92
8.07
3.1.4 Land Use Changes Under Different Scenarios
3.1.4.1 Accuracy Analysis of Land Use Simulation
GCAM model is applied to simulate structure and amount of land use types in
1990, 2005 and 2010. We analyze land use simulation accuracy according to the
comparison of simulated land use and real land use in 1990, 2005 and 2010
(Fig.
3.1
, Table
3.4
).
As seen from the comparison of simulation results and real land use in 1990,
2005 and 2010 in Fig.
3.1
, we found that the simulation results is similar to the real
land use change. Cultivated land increases due to population growth and domestic
demand expansion. A larger demand for timber because of social and economic
development, so that forestry area shows a downward trend overall, but the
decreasing ratio is declining. As for the grassland, overgrazing has caused serious
area shrinking. In the past decades, with rapid economic development, urbaniza-
tion is rising all the way and it brings about the built-up area keeping expanding in
recent years. We are unconcerned about desert, Gobi and other land that is difficult