Geography Reference
In-Depth Information
2.5
×
10
8
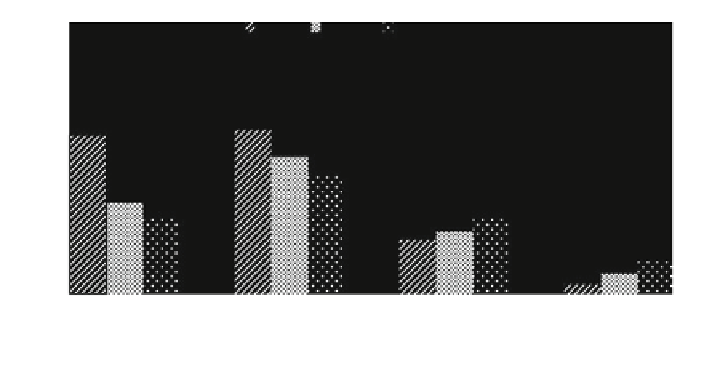
GTAP
GCAM
Current
2
1.5
1
0.5
0
Cropland
Forest
Grassland
Built-up land
Fig. 2.7 The comparison of land use area in China in 2010 simulated with the calibrated GCAM
model and the GTAP model and the real values (hectare)
development of China and consequently made it very difficult to accurately sim-
ulate the land use change in China using models with static data. For instance, the
estate price in China has fluctuated prominently during the past decades, but a
static estate price is first used in the GCAM model in this study, which makes it
obviously difficult to simulate the constantly changing industrial structure in
China. Therefore, it is necessary to calibrate the models before simulating the land
use change.
In order to more accurately simulate the change of the land use structure in
China according to the reality and improve the precision of future scenario sim-
ulation, we calibrated the parameters of the GCAM model and the GTAP-AEZ
model (Table
2.3
). The influence of policy intervention is included in the models
according to the specific national condition of China, and other parameters were
also calibrated. In this study, the price of agricultural products is set to increase by
1.5 % every year, TFP will increase by 0.1 %, and the annual population growth
rate will decrease from 0.8 to 0.5 %. The results indicate that the land use structure
simulated with the calibrated GCAM model becomes much more accurate than
before and has more closely approached to the reality. Besides, the simulation
accuracy with the calibrated GCAM model is much higher than that with the
calibrated GTAP-AEZ model (Fig.
2.7
).
2.3.5 Concluding Remarks on Combining Emission
Scenarios with Land Use Changes
This study simulated the LUCC in China under the RCP 4.5 scenario with GCAM
and GTAP-AEZ, and compared the simulated and real land use structures. The
simulation results obtained with GCAM and GTAP-AEZ are generally consistent,