Geography Reference
In-Depth Information
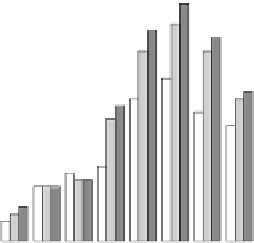
Fig. 7.28 Effects of future
urban expansion on average
monthly temperature and
precipitation in nonurban area
in the Northeast megalopolis,
USA. Panel A number of
pixels with average monthly
temperature change
exceeding ±0.5 C; Panel B
number of pixels with
average monthly precipitation
change exceeding ±1mm
Panel
(
a)
1
2
3
4
5
6
7
8
9
10
11
12
Month
Panel (b)
2010−2020
2040−2050
2
0
90
−
21
0
0
1
2
3
4
5
6
7
8
9
10
11
12
Month
Moreover, the future urban expansion will also impact the average monthly
temperature in nonurban area. We counted the number of pixels with average
monthly temperature changes exceeding ±0.5 C (Fig.
7.28
, Panel A). This
number indicates these areas severely influenced by future urban expansion on
average monthly temperature. The influence will be large during the period from
July to January at least 20 pixels, which means an area of more than 5.00 9 10
4
km
2
will be affected by future urban expansion. Especially in the period of
2090-2100, the urban expansion will lead to the change on average monthly
temperature with more than ±0.5 C in a vast area of 1.10 9 10
5
km
2
. Further, the
increase of pixels in which average monthly temperature changes exceeding
±0.5 C at the temporal scale indicates that more area will be influenced by future
urban expansion. In sum, the larger the urban area expands, the more notable will
be the effects on average monthly temperature.