Geography Reference
In-Depth Information
80 ° W
75 ° W
70 ° W
65 ° W
80 ° W
75 ° W
70 ° W
65 ° W
80 ° W
75 ° W
70 ° W
80 ° W
75 ° W
70 ° W
80 ° W
75 ° W
70 ° W
65 ° W
80 ° W
75 ° W
70 ° W
65 ° W
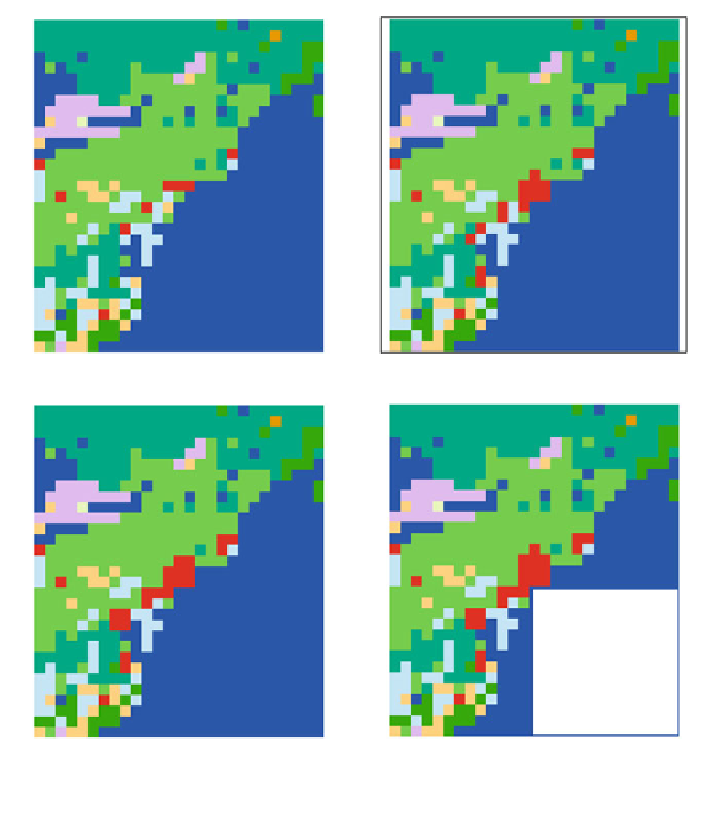
Urban and built -up land
Dryland cropland and pasture
Irrigated cropland and pasture
Cropland/grassland mosaic
Cropland/woodland mosaic
Grassland
Decidous broadleaf forest
Evergreen needleleaf
Mixed forest
Water Bodies
80 ° W
75 ° W
70 ° W
80 ° W
75 ° W
70 ° W
Fig. 7.24 Baseline underlying surface data (1993) and predicted underlying surface data (2010,
2040 and 2090) used in this study
from deciduous broadleaf forest to urban area will drive the average annual
temperature of the pixel (395
´
N, 755
´
W) growing by 3.15, 3.53, and 3.76 Cin
the period of 2010-2010, 2040-2050 and 2090-2100, respectively.
There will be some nonurban pixels experiencing average annual temperature
decrease due to future urban expansion, while the annual average temperature of
most nonurban areas will be steady. The significant annual average temperature
decrease will mainly happen in the south of the Northeast megalopolis with mixed
forest (Fig.
7.25
). Statistics shows that this annual average temperature decrease
will range from 0.40 to 1.20 C. Consequently, the cooling effect in this area will