Geography Reference
In-Depth Information
Table 7.6 Coverage percentage of various land cover type (%)
USGS land cover classification
Coverage percentage
2000
2010
2100
1 Urban
0.65
0.59
0.62
2 Dryland cropland and pasture
31.07
28.59
32.21
3 Irrigated cropland and pasture
0.00
0.00
0.00
5 Cropland/Grassland mosaic
1.07
0.78
1.01
6 Crop/woodland mosaic
20.90
24.00
39.05
Sum of Cropland
53.04
53.37
72.27
7 Grassland
0.18
0.12
0.03
8 Shrub land
0.01
0.01
0.01
10 Savanna
0.12
0.07
0.00
11 Deciduous broadleaf forest
0.24
0.06
0.01
12 Deciduous broadleaf forest
0.27
0.13
0.02
14 Evergreen needleleaf forest
9.87
8.54
6.76
15 Mixed forest
33.85
35.33
18.51
16 Water bodies
1.74
1.74
1.74
Sum of forests
44.22
44.07
25.30
18 Wooded Wetland
0.00
0.00
0.00
19 Barren or sparsely vegetated
0.02
0.02
0.01
21 Wooded tundra
0.00
0.00
0.00
22 Mixed tundra
0.01
0.01
0.01
Total
100
100
100
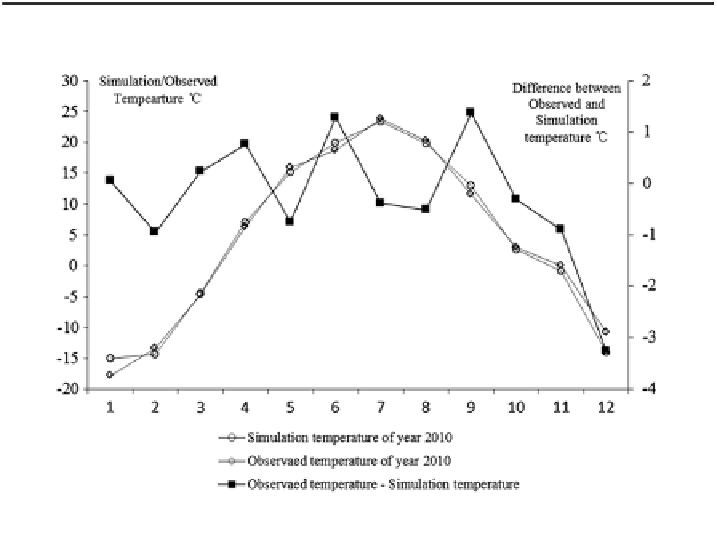
Fig. 7.9 Comparison of simulated and observed values of the monthly average near-surface
temperature at 2 meters above the ground of the study area