Geography Reference
In-Depth Information
40°0'0"E
45°0'0"E
50°0'0"E
55°0'0"E
Legend
Urban and Built-Up Land
Dryland Cropland and Pasture
Irrigated Cropland and Pasture
Mixed Dryland/Irrigated Cropland and Pasture
Cropland/Grassland Mosaic
Cropland/Woodland Mosaic
Grassland
Shrubland
Mixed Shrubland/Grassland
Savanna
Deciduous Broadleaf Forest
Deciduous Needleleaf Forest
Evergreen Broadleaf Forest
Evergreen Needleleaf Forest
Mixed Forest
Water Bodies
Herbaceous Wetland
Wooded Wetland
Barren or Sparsely Vegetated
Herbaceous Tundra
Wooded Tundra
Mixed Tundra
Bare Ground Tundra
Snow or Ice
60°0'0"N
60°0'0"N
55°0'0"N
55°0'0"N
45°0'0"E
50°0'0"E
55°0'0"E
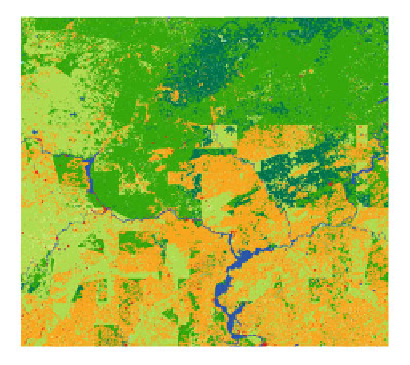
Fig. 7.7
Land cover of the study area in year 2010
Totally, the forests coverage in the study area will decrease from 44.40 to 44.07 %,
while that of the croplands will increase from 53.04 to 53.37 %. The conversion
between the forests and croplands will be in balance during 2000-2010. However,
the spatial heterogeneity of the land conversion will redistribute the land cover
types. For example, the croplands in the northern part of study area have a ten-
dency to be converted to forests, while the scattered forests in the southern part
tend to be converted to croplands (Fig.
7.7
).
By 2100, the conversion from forests to croplands will dominate in the study
area. The grids presenting the conversion from forests to croplands will account
for 37.4 % of all the grids. Then the croplands coverage will go up to 72.27 % of
the total land area, while the forests coverage will decrease to 25.31 % (Fig.
7.8
).
It indicates that there is a strong tendency of conversion from forests to croplands
in this region in the future 100 years.
The coverage percentage of different land cover type in year 2000, 2010, and
2100 which were calculated based on the amount of grids of each land cover type
are shown in Table
7.6
.
7.2.1.4 Validation of the Simulation Result
As shown in Fig.
7.9
, the change trends of both simulated and observed monthly
average temperature in the study area were relatively similar, and the difference
between the observed and simulated values generally fluctuates around zero. To
examine whether the difference was significant or not, a paired T-test was con-
ducted to test the difference between simulated values and observed values. The