Geography Reference
In-Depth Information
(a)
(b)
32.2
0.97
32.2
32
32
0.96
0.96
31.8
31.8
0.95
0.95
31.6
31.6
0.94
0.94
31.4
31.4
0.93
0.93
31.2
31.2
0.92
0.92
31
31
118.5
119
119.5
120
120.5
121
118.5
119
119.5
120
120.5
121
(c)
(d)
0.97
32.2
32.2
0.97
32
0.96
32
0.96
0.95
31.8
31.8
0.95
0.94
31.6
31.6
0.94
0.93
31.4
31.4
0.93
0.92
31.2
31.2
0.92
0.91
31
31
118.5
119
119.5
120
120.5
121
118.5
119
119.5
120
120.5
121
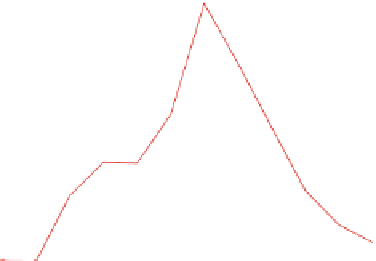
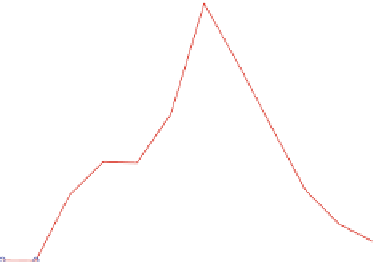
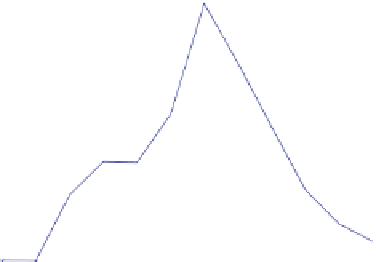
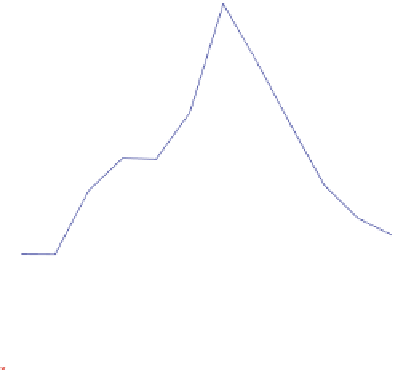
Fig. 6.12 Spatial pattern of the land surface emissivity in Southern Jiangsu under different
scenarios. a and b Show the simulation result of land surface emissivity of land use in Southern
Jiangsu in year 2010 under REG scenario and CES scenario, respectively; c and d show the
simulation result of land surface emissivity of land use in Southern Jiangsu in year 2050 under
REG scenario and CES scenario, respectively
Fig. 6.13 Comparison of the
latent heat flux in Southern
Jiangsu under different
scenarios (W/m
2
)
80
70
60
50
40
30
20
10
0
0
2
4
6
8
10
12
Month
Land 2050 in REG
Land 2050 in CES
Land 2010 in REG
Land 2010 in CES
6.2.5 Concluding Remarks on Urbanization and its Climate
Effects in Southern Jiangsu Province
(i)
Land use change in Southern Jiangsu province shows different changing
trends under different scenarios, but it is mainly characterized by the
expansion of urban land and shrinkage of cultivated land and forest. Under