Geography Reference
In-Depth Information
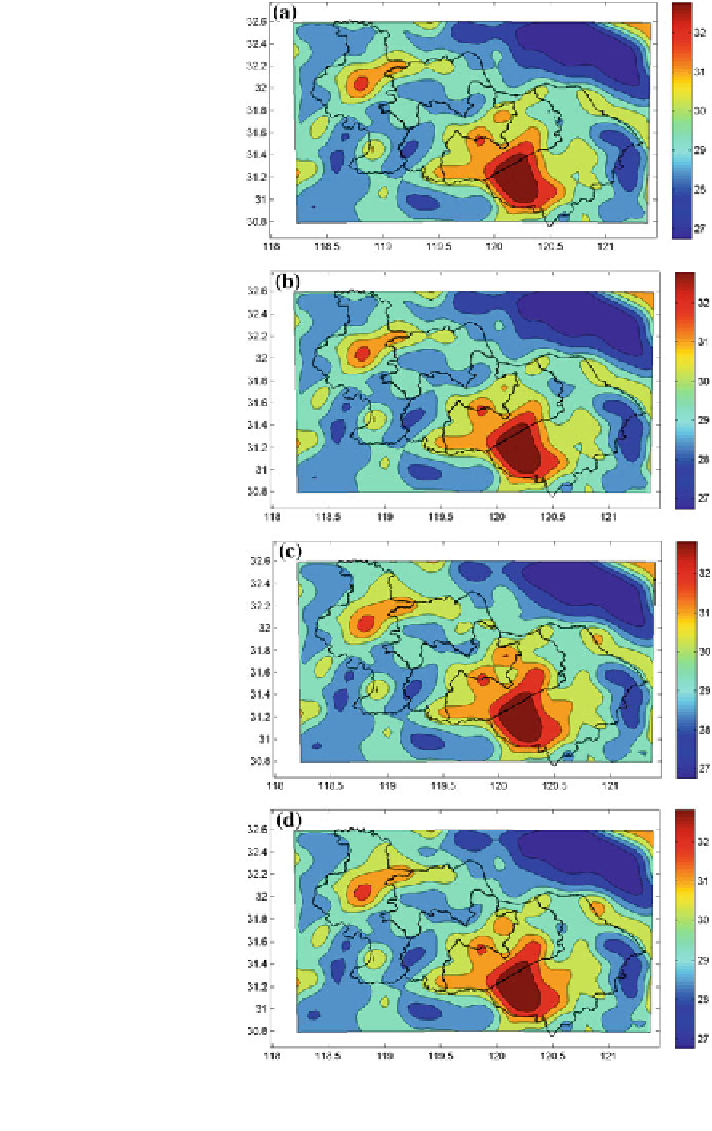
Fig. 6.10 Spatial pattern of
the monthly average
temperature in Southern
Jiangsu in July under
different scenarios (C). a and
b Show the simulation result
of monthly average
temperature in Southern
Jiangsu in July of land use in
year 2010 under REG
scenario and CES scenario,
respectively; c and d show
the simulation result of
monthly average temperature
in Southern Jiangsu in July of
land use in year 2050 under
REG scenario and CES
scenario, respectively