Geography Reference
In-Depth Information
Table 4.7 Simulated and observed values of the seasonal average temperature at 2 m above the
ground surface in the North China Plain (C)
Season
Winter
Spring
Summer
Autumn
Simulated value
0.89
12.76
23.03
14.27
Observed value
1.33
14.43
25.72
15.27
Ratio between simulated value and observed value
0.44
1.67
2.68
0.99
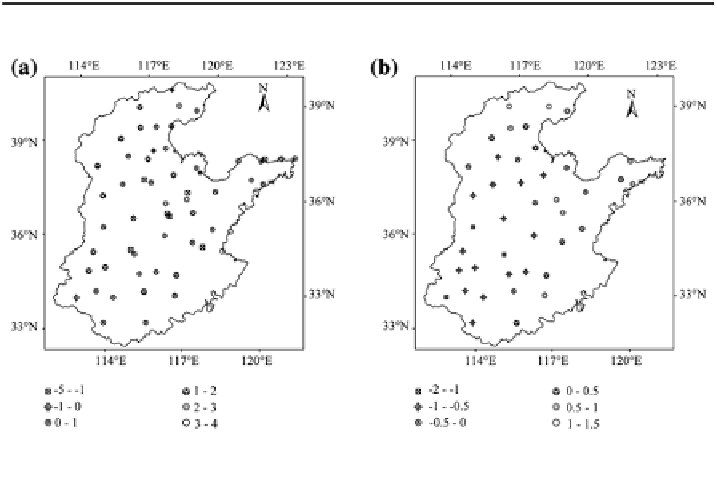
Fig. 4.13 Difference between the observed and simulated daily average temperature in the North
China Plain in February and August
observation stations is 1.09 C higher than the observed temperature on average.
The observation stations with the lower simulated temperature are mainly located
in the middle part of Hebei Province and Shandong Province, while that with the
higher simulated temperature mainly concentrate in the eastern piedmont of Tai-
hang Mountain and inner part of Henan Province. By contrast, the differences
between the observed and simulated daily average temperatures in August in 42
observation stations reach the significance level. The simulated value of the 17 out
the 42 observation stations is 0.51 C lower than the observed value on average.
While the simulated temperature of the other 25 observation stations is 0.98 C
higher than the observed one on average. The observation stations with the lower
simulated temperature are mainly located in Henan Province and Hebei Province.
In summary, the analysis suggests the WRF model can simulate the seasonal
change and spatial pattern of temperature in the North China Plain very well. Although
there is some difference between the observed and simulated value, with the simulated
temperature being lower than the observed temperature on the whole, there is no
significant difference in the spatial patterns of the observed and simulated tempera-
tures on the whole. There is only some large difference in very few areas, indicating
the WRF model has a great advantage in the simulation of the climate in the plain area.