Geoscience Reference
In-Depth Information
1
900
test−1
test−2, L−data
test−2, R−data
test−1
test−2, L−data
test−2, R−data
0.9
850
0.8
800
0.7
750
0.6
700
0.5
650
0.4
600
0.3
550
0.2
500
0.1
450
0
400
−1
−0.5
0
0.5
1
−1
−0.5
0
0.5
1
x
x
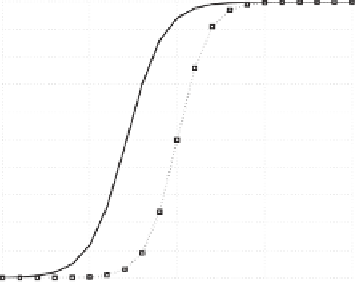
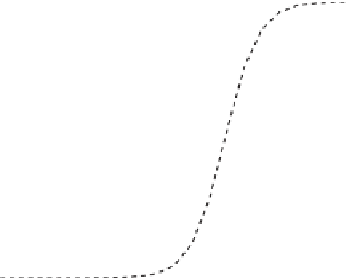
(a) decision boundary fit
(b) response time fit
Figure 7.4:
Gaussian Mixture Models make predictions that fit human behaviors in the ZRQK study.
Condition 1: The subject receives 800 stimuli, one at a time, each randomly sampled from
the Gaussian mixture. The subject has to classify each stimulus into one of the two classes. In
half of the cases, after making a guess, the subject receives feedback informing her of the true
class of the stimulus. In the other half, she receives no feedback. Therefore, there is an equal
number of labeled and unlabeled instances.
Condition 2: Same as condition 1, except that if an instance is unlabeled, its corresponding
Gabor patch is replaced by the characters “X” or “N” during display. This turns all the unlabeled
data trials into unrelated “filler trials,” thus removing the effect of unlabeled data.This condition
is therefore similar to pure supervised learning, but properly adjusted to match condition 1.
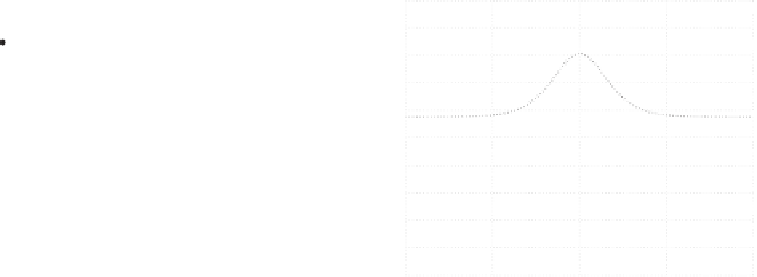
class 1
class 2
frequency
(a) the two classes
(b) two Gabor patches
Figure 7.5:
The binary classification task in the VDR study.