Geoscience Reference
In-Depth Information
74 CHAPTER 7. HUMAN SEMI-SUPERVISEDLEARNING
shifted subjects span the same range, so that any measured shift in the decision boundary
cannot be explained by differences in the range of instances viewed.
4. Test-2: same as test-1, to test the learned decision boundary from both the labeled and unla-
beled data.
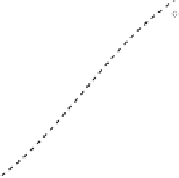
The ZRQK study found that unlabeled data shifts human classification decision boundaries
as expected by semi-supervised learning. Figure 7.3(a) shows the logistic function fit to the empir-
ical fraction
x
)
, i.e., the fraction of human subjects classifying a given
x
as positive. The
decision boundary can be estimated as the
x
for which the curve intersects
p(y
=
1
|
p(y
ˆ
=
1
|
x
)
=
0
.
5.For
=
all participants in test-1 (the dotted curve), the decision boundary is at
x
0
.
11, close to the ex-
pected boundary at zero from supervised learning. The curve is also relatively steep, showing that
the participants are highly consistent in their classifications immediately after seeing the 20 labeled
instances. For R-subjects in test-2 (the dashed curve), the decision boundary is at
x
=
0
.
48. This
represents a shift to the right of 0.37, compared to test-1. This shift represents the effect of unlabeled
data on the R-subjects and fits the expectation of semi-supervised learning. For L-subjects in test-2
(the solid curve), the decision boundary is at
x
=−
0
.
10. This represents a shift to the left by -0.21,
also consistent with semi-supervised learning.
1
900
test−1, all
test−2, L−subjects
test−2, R−subjects
test−1, all
test−2, L−subjects
test−2, R−subjects
0.9
850
0.8
800
0.7
750
0.6
700
0.5
650
0.4
600
0.3
550
0.2
500
0.1
450
0
400
−1
−0.5
0
0.5
1
−1
−0.5
0
0.5
1
x
x
(a) empirical
p(y
=
|
1
x
)
(b) response time
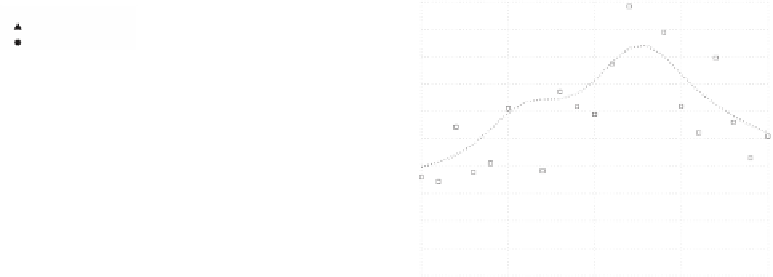
Figure 7.3:
In the ZRQK study, unlabeled data changes human concept boundaries, as revealed by
classification and response time.
As additional evidence for boundary shift, the ZRQK study observed changes in response
time. A long response time implies that the stimulus is relatively difficult to classify. Stimuli near
the decision boundary should be associated with longer response times. Figure 7.3(b) shows mean
response times on test-1 (dotted line). After seeing just the labeled instances at
x
=
1,
people react quickly to examples near them (600ms), but are much slower (800ms) for instances “in
=−
1 and
x