Game Development Reference
In-Depth Information
Debugging and Breakpoints
For heavy-duty debugging, I would use breakpoints and Visual Studio's debugger. Hopefully
you are familiar with how breakpoints work. For a quick refresher, you simply make a line of
code where it should pause when executing. This allows you to explore the state of the ap-
plication and view any objects in memory. To add a breakpoint, left click in the grey area on
the left-hand side of the line numbers running down the editor (
Figure 5-1
)
.
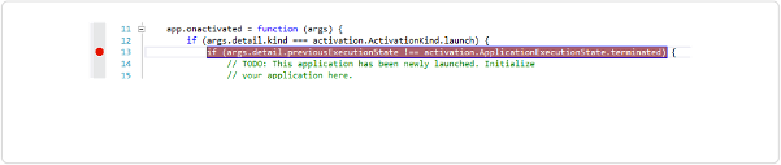
Figure 5-1. Here is what a breakpoint looks like when the code is executed and stopped for you to
debug it.
Once you do this a red dot will show up. When you run the app, the debugger will pause on
that line and throw you back into Visual Studio. At this point you can start exploring the ob-
jects in your game. Simply roll over an element, such as the argument being passed into a
function, and you will be able to see everything within that scope (
Figure 5-2
).