Geology Reference
In-Depth Information
100
Mercury
90
80
Arsenic
Tin
Antimony
Gold
Lead
Silver
70
Zinc
Barium
Cadmium
Strontium
60
Fluorspar
Copper
Manganese
Wolfram
50
Selenium
Lithium
Bismuth
Boron
Nickel - sulfides
Indium
Molybdenum
40
Graphite
Titanium-rutile
Phosphate rock
Zirconium
30
Rhenium
Uranium
Iron ore
Tellurium
Titanium-ilmenite
Cobalt
Niobium
20
Tantalum
Aluminium (Bauxite)
PGM
Potash
Vanadium
10
Iodine
REE
Cesium
Thorium
0
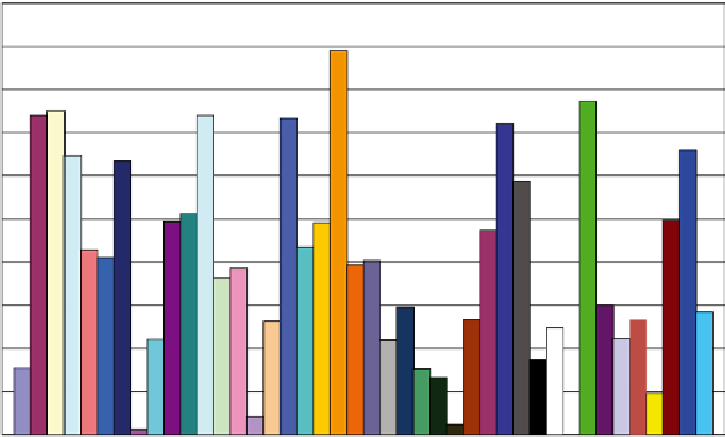
Fig. 13.35 Depletion degree in % of the main non-fuel mineral commodity reserves
constant over time, plotting production versus time in tonnage, in terms of exergy
or in exergy replacement cost will not affect the final result. In this case, the exergy
replacement costs (B
) versus time have been plotted, since the production patterns
obtained will be represented in “exergy countdown” diagrams.
Table 13.4 shows the theoretical peak considering available reserves and world
resources as published by the USGS in 2010. For those minerals where no world
resource data was available, information on reserve base
14
was used instead, as is
the case for gold, silver, tantalum and antimony. The regression factors of each fit
are shown (R
2
) in addition to the observed empirical peak, should it have already
occurred.
Table 13.4: The peak in production of some of the world's most important
mineral commodities.
Theoretical Data
Empirical Data
R
2
W.R. Peak
R
2
Observed Peak
Reserves Peak
Aluminium
2050
0.98
2088
0.98
-
Antimony
1998
0.56
2006 (R.B.)
0.64
-
Arsenic
1971
0.29
2056
0.31
2006
Beryllium
2082
0.40
1981
Bismuth
2015
0.87
2042
0.86
-
Cadmium
1996
0.98
2076
0.90
2000
Continued on next page :::
14
The USGS has stopped providing information for the reserves base and hence 2006 data has
been included in the table.


Search WWH ::

Custom Search