Geology Reference
In-Depth Information
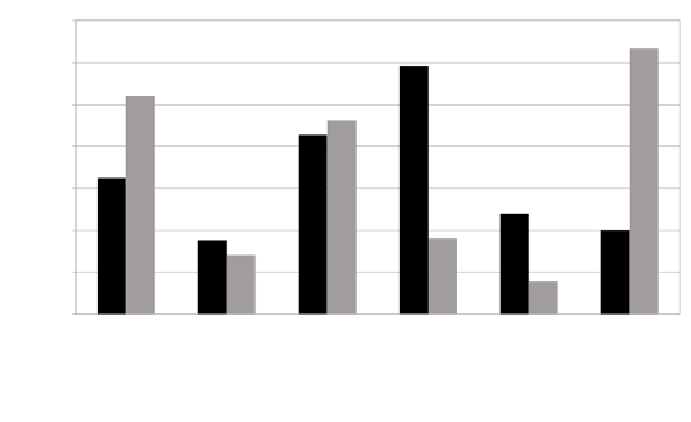
1400
Mtoe
1200
1000
800
600
400
200
0
North America
S. & Cent.
America
Europe & Eurasia
Middle East
Africa
Asia Pacific
Oil: Production
Oil: Consumption
Fig. 6.8 Oil production and consumption at the end of 2010. Elaborated from data included in
BP (2011)
Distribution of natural gas reserves in the world
80000
Bm
3
70000
60000
50000
40000
75,802.89
63,078.85
30000
20000
10000
16,191.43
14,726.79
9,934.38
7,407.92
0
North America
S. & Cent. America
Europe & Eurasia
Middle East
Africa
Asia Pacific
Fig. 6.9 Natural gas proved reserves at the end of 2010. Values in billion cubic meters. Elaborated
from data included in BP (2011)
registered a test production of 2,900 barrels/day of oil and 57,000
m
3
/day of gas.
The optimists appeal to improvements in technology, such as 3D seismic surveys and
extended reach e.g. horizontal drilling. These technologies have led to more e
cient


Search WWH ::

Custom Search